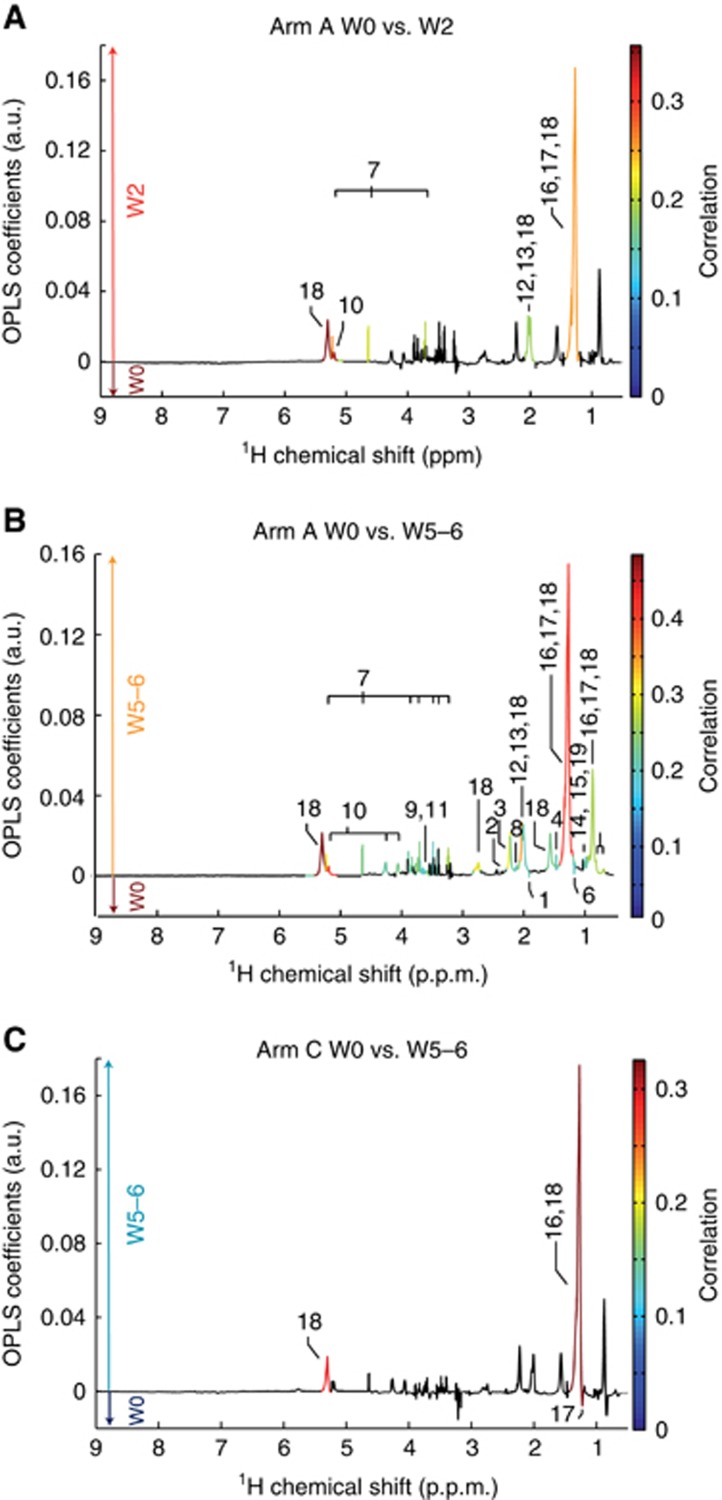
Figure 3.
Metabolic fingerprints associated with mRCC targeted therapies. O-PLS loadings plots are represented for arm A: (A) W0 vs W2, and (B) W0 vs W5–6, and for arm C: (C) W0 vs W5–6. Statistically significant individual signals correspond to the coloured spectral regions. Highlighted candidate markers are: (1) acetate, (2) acetoacetate, (3) acetone, (4) alanine, (5) cholesterol (C18, C26, C27), (6) ethanol, (7) glucose, (8) glutamine, (9) glycerol, (10) glycerol backbone of pglys and tags, (11) glycine, (12) N-acetylglycoprotein (NAC1), (13) NAC2, (14) isoleucine, (15) leucine, (16) fatty acids (mainly LDL), (17) fatty acids (mainly VLDL), (18) fatty acids and (19) valine. LDL=low-density lipoprotein; VLDL=very low-density lipoprotein; PGLYs=phosphoglycerides; TAGs=triglycerides.

