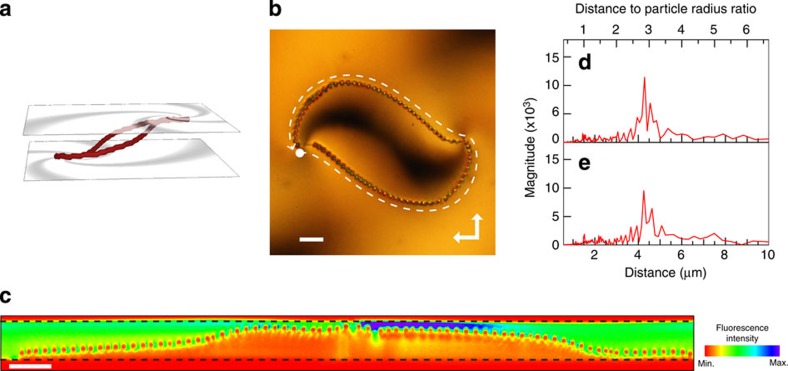
Figure 3. Templated three-dimensional assembly of colloidal particles.
(a) Three-dimensional profile of the disclination network formed between spirally patterned substrates with (s, c)=(1, 0), calculated from a Landau–de Gennes theory. The cell gap has been extended twofold for clarity. (b) POM image of the disclination network decorated with colloidal particles of 3 μm in diameter. The white dashed line indicates the direction along which the cross-sectional profile was measured. Scale bar, 20 μm. (c) Cross-sectional TPEM profile along the disclination shown in b. The dashed lines mark the substrate boundaries. (d,e) FFT magnitude of the TPEM intensity along the left and right particle chains shown in c.

