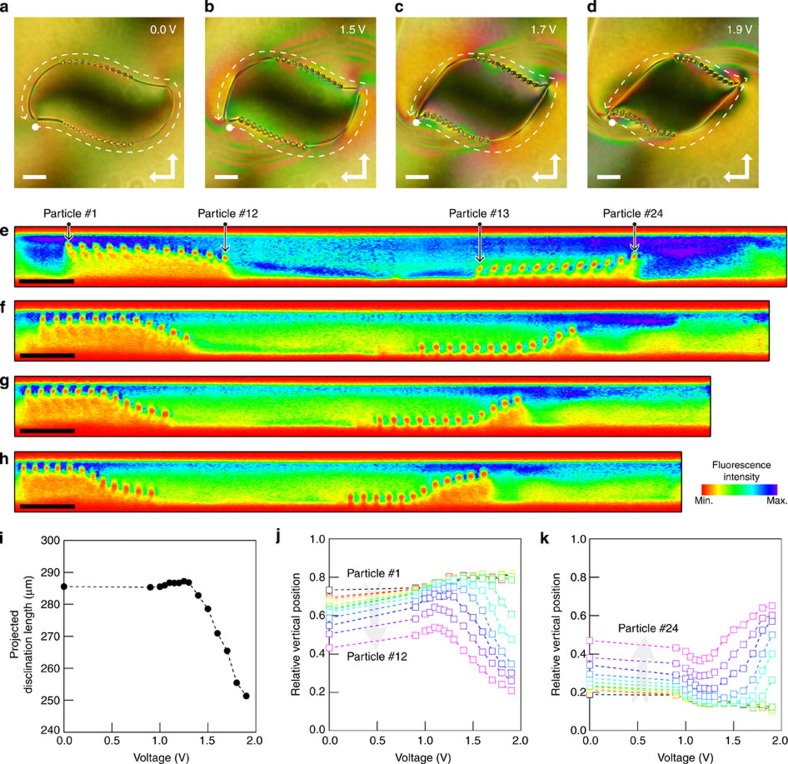
Figure 5. Field-induced reconfiguration of disclination shapes and particle positions.
(a–d) POM images of the colloid-decorated disclination network constructed using two substrates with spiral defects of (s, c)=(1, 0) at various applied voltages. White dashed lines indicate the direction along which the cross-sectional profile was measured. Scale bars, 20 μm. (e–h) TPEM profiles along the disclination lines in a–d. (i) Voltage dependence of two-dimensionally projected disclination length measured from the POM images. Relative vertical positions of the particles in the lower (j) and upper (k) chains in the POM images, where the cell gap is normalized to 1. Particles are numbered from 1 to 24 in the order or appearance along the profile path (see e).

