
Figure 2.
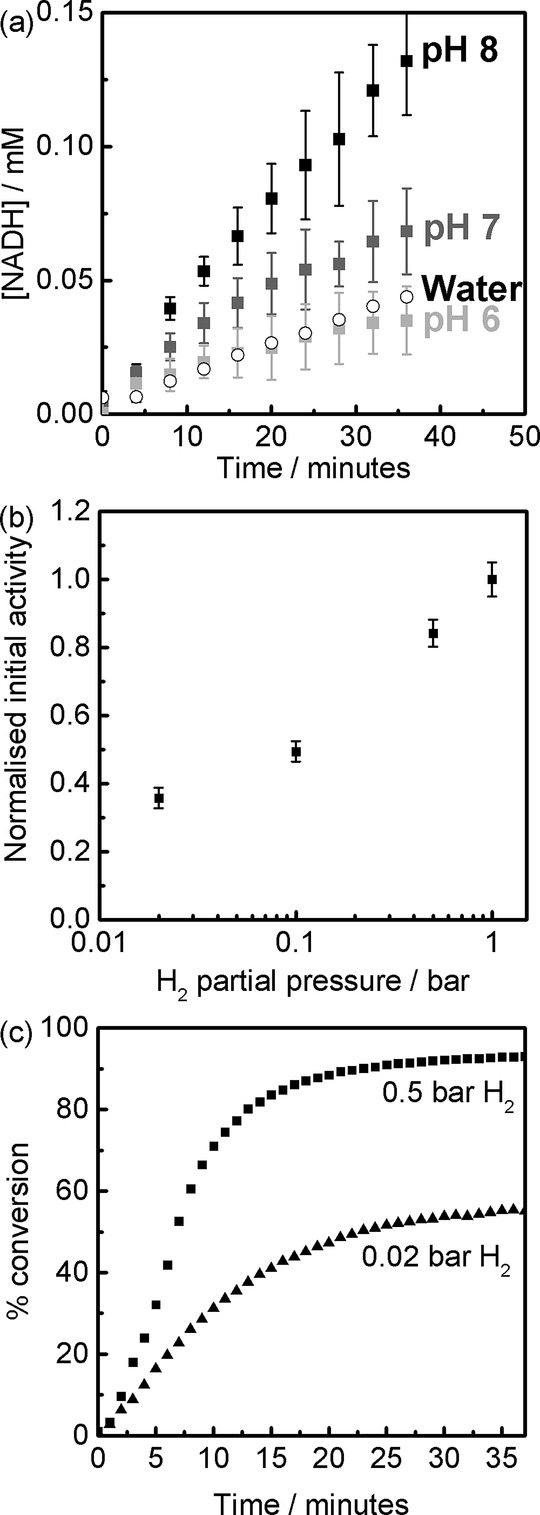
Parameters that affect H2-driven NADH generation by particles modified with hydrogenase and NAD+ reductase. a) Time series for H2-driven NADH generation by identical aliquots of particles at a range of pH values; pH 6.0 (50 mm potassium phosphate, KBP), pH 7.0 (KPB), pH 8.0 (50 mm Tris-HCl) and un-buffered MilliQ water. Other conditions: 1 mm NAD+, 33 °C, stirring, H2 flow through the headspace. Initial activities were 0.8, 1.9, 3.4 and 1.0 μmol min−1 per mg NAD+ reductase respectively for the pH 6, 7, 8 and water series. Error bars reflect the average value ±1 standard deviation calculated from measurements performed in triplicate. b) Relative initial activity (normalised to the value at 100 % H2, 1 bar) of H2-driven NADH generation under different H2/N2 mixtures (100, 50, 10 and 2 % H2) at overall atmospheric pressure. Other conditions: 0.1 mm NAD+, 50 mm Tris-HCl pH 8, 30 °C. c) Plot of NAD+ to NADH conversion from b) at 0.5 and 0.02 bar H2.