
Table 3.
Benzomorpholinone series hit to lead optimisation
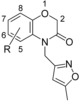 | |||||||
|---|---|---|---|---|---|---|---|
| Compd | R | IC50 [μm][a] | EC50 [μm][a] | Selectivity | LE[b] | ||
| TbNMT | hNMT | T. brucei | MRC5 | ratio | TbNMT | ||
| 33 | H | 2.9 | >100 | ND | ND | – | 0.43 |
| 34 | 2-CH3 | >100 | >100 | ND | ND | – | – |
| 35 | 6-Chloro | >100 | >100 | ND | ND | – | – |
| 36 | 7-Chloro | 7.1 | >100 | ND | ND | – | 0.37 |
| 37 | 7-Bromo | 6.4 | >100 | ND | ND | – | 0.37 |
| 38 | 8-Bromo | 11 | >100 | ND | ND | – | 0.37 |
| 39 | 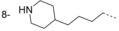 |
0.008 | 0.7 | 0.41 | >50 | 2 | 0.40 |
| 40 | 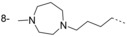 |
<0.002 | 1.0 | 0.08 | 24 | 13 | >0.38 |
| 41 | 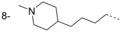 |
<0.002 | 0.9 | 0.19 | 19 | 5 | >0.40 |
| 42 | 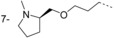 |
0.009 | 24 | 0.35 | >50 | 69 | 0.38 |
| 43 | 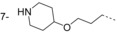 |
<0.002 | 0.9 | 0.15 | 22 | 6 | >0.40 |
| 44 | 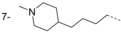 |
<0.002 | 0.04 | 0.007 | 10 | 6 | >0.40 |
[a] Values shown are the mean of two or more determinations; ND=not determined. [b] Ligand efficiency (LE), determined for compounds with T. brucei NMT potency <50 μm, was calculated as 0.6 ln(IC50)/(heavy atom count) for TbNMT.[11] [c] Selectivity ratio: hNMT (EC50)/T. brucei cell (EC50).