
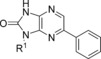
Table 7.
Variation of the R1 group of compound 19
 | |||||
|---|---|---|---|---|---|
| ID | R1 | clogP | EC50 [μm][a] | Aq. Sol. | |
| T. b. brucei | MRC5 | [μm][b] | |||
| 19 |  |
3.9 | 0.04 | >50 | 110 |
| 36 |  |
2.5 | 0.3 | >50 | ND |
| 37 |  |
2.9 | >50 | >50 | ND |
| 38 |  |
2.3 | 0.1 | >50 | 55 |
| 39 |  |
2.0 | 0.2 | >50 | ND |
| 40 |  |
1.7 | 0.5 | >50 | ND |
| 41 |  |
1.7 | 13 | >50 | ND |
| 42 |  |
2.4 | 2 | >50 | ND |
[a] Values are the geometric mean of two or more determinations; standard deviation is typically within 2-fold of the EC50 value. [b] Aqueous kinetic solubility. ND: not determined.