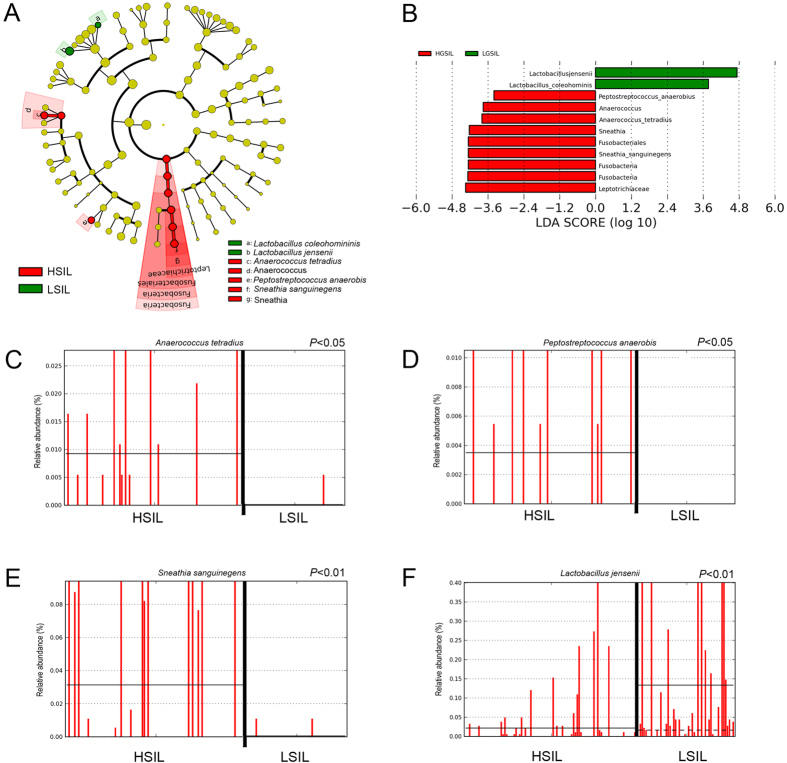
Figure 5. Identification of vaginal microbiota biomarkers of LSIL vs. HSIL by LEfSe analysis.
(A) Cladogram representing taxa with different abundance according to disease severity. Size of circle is proportionate to abundance of taxon. (B) Histogram of the LDA scores computed for features differentially abundant between LSIL and HSIL disease states. Relative abundance counts of Anaerococcus tetradius (C), Peptostreptococcus anaerobis (D) and Sneathia sanguinegens (E), which were found to be significantly over-represented in HSIL whereas Lactobacillus jensenii (F) was enriched in LSIL samples (Welch’s t-test). KEY - HSIL: High-grade squamous intra-epithelial lesion; LDA score: Linear discriminant analysis score; LSIL: Low-grade squamous intra-epithelial lesion.

