Figure 3.

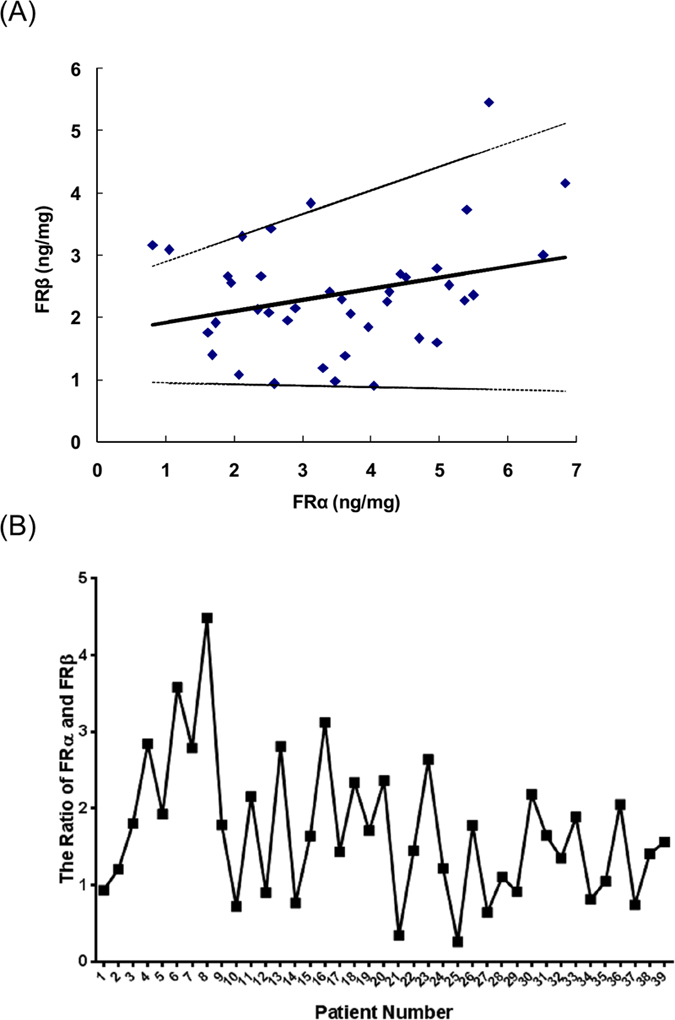
The ratio of FRα to FRβ in breast cancer patients (A) and the regression analysis of FRα with FRβ (B). The solid line corresponds to the regression line. Dashed lines represent the 95% confidence interval for the regression line.

The ratio of FRα to FRβ in breast cancer patients (A) and the regression analysis of FRα with FRβ (B). The solid line corresponds to the regression line. Dashed lines represent the 95% confidence interval for the regression line.