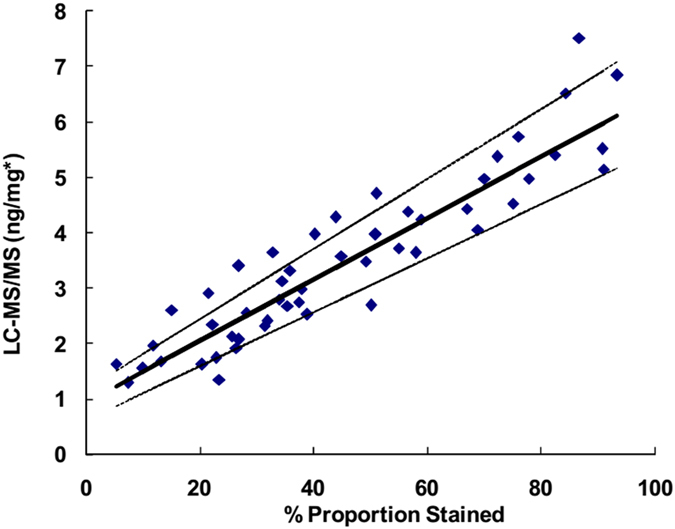
Figure 5. Passing-Bablok regression analysis for the IHC vs. the LC-MS/MS assay.

The solid line corresponds to the regression line. Dashed lines represent the 95% confidence interval for the regression line. *FRα ng/mg breast tissue.

The solid line corresponds to the regression line. Dashed lines represent the 95% confidence interval for the regression line. *FRα ng/mg breast tissue.