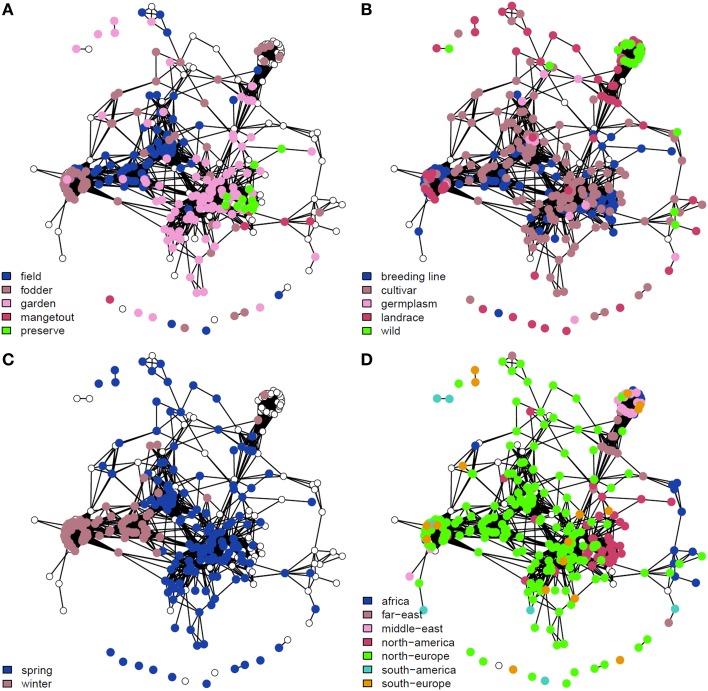
Figure 2.
Genetic dissimilarity amongst the 339 pea accessions composing the genetic resource collection. Two-dimensional networks were constructed using the R package, network (Butts, 2008). Each accession is represented by a dot. Pairs of accessions with a genomic relationship coefficient >0.2 are linked. Major classes for the use type (A), the population type (B), the sowing type (C), and the geographic origin (D) are color-coded. Uncolored dots correspond to accessions that were not assigned to any of the classes.

