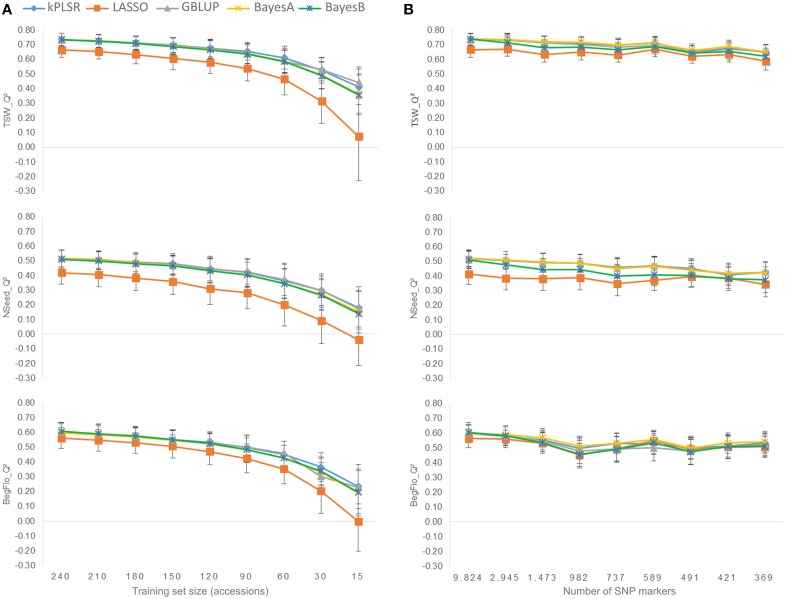
Figure 3.
Effect of the calibration set size (A) and marker density (B) on the prediction quality of TSW, Nseed, and BegFlo of the CRB339 collection. Nine different tests per parameter were conducted. For each trait and each parameter, means and standard deviations of Q2 resulting from five statistical methods (see color codes) were used to construct the corresponding plot.

