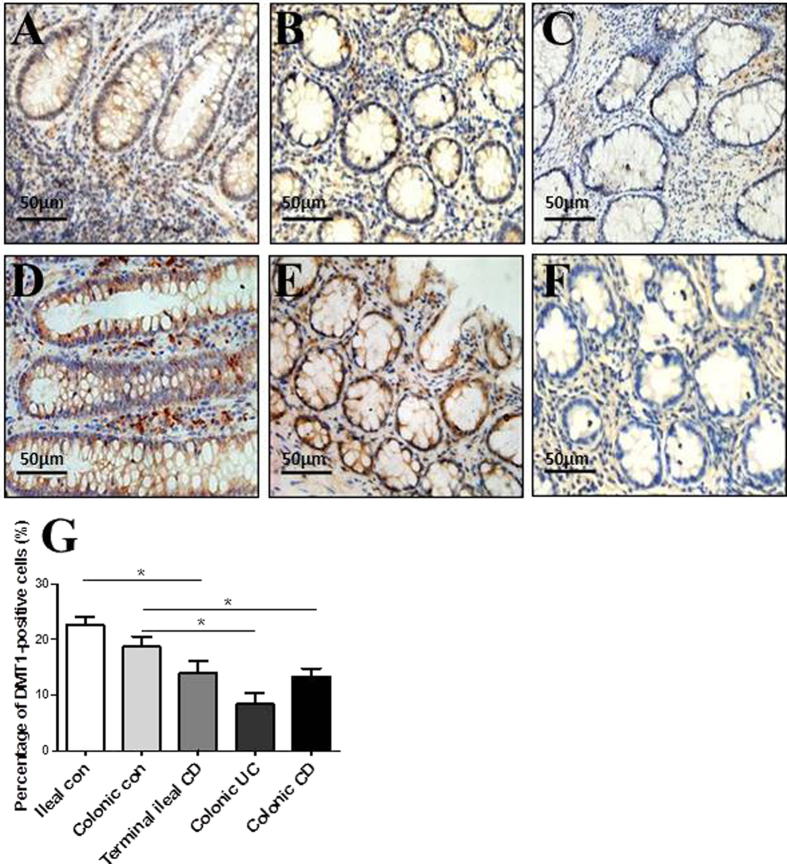
Figure 4. In situ expression of DMT1 in intestinal mucosa.
Representative frozen sections were prepared from inflamed mucosa of a patient with terminal ileal CD (A), a patient with colonic CD (B), a patient with colonic UC (C), a healthy ileal control (D), a healthy colonic control (E), and negative control (F) by immunohistochemistry (original magnification, ×400). (G) Quantification of DMT1-positive cells in the intestinal mucosa of ileal control, colonic control, terminal ileal CD, colonic UC and colonic CD. The percentage of positive cells was calculated as follows: [(positive cells)/(total cells)] × 100. Data are expressed as mean values of positive cells per high power field ± SEM of 3 independent experiments. One way ANOVA was performed. *P < 0.05.

