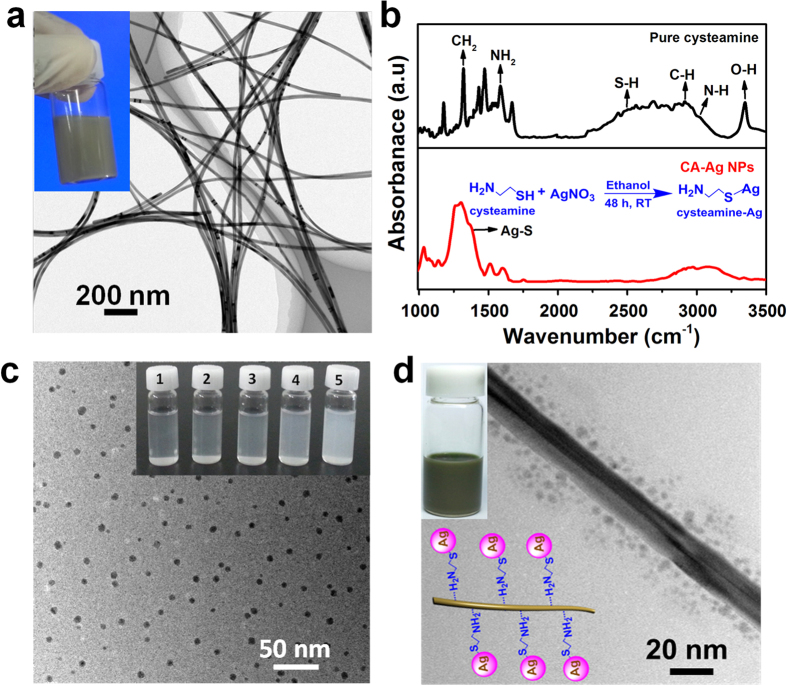
Figure 1. Synthesis of CA-Ag NP/Ag NWs.
(a) HRTEM image of Ag NWs. The inset shows an aqueous suspension of Ag NWs (0.5 wt%). (b) FTIR spectra of pure cysteamine and CA-Ag NPs (cysteamine concentration = 6 × 10⁻⁵ moles). (c) HRTEM image of CA-Ag NPs (cysteamine concentration = 6 × 10⁻⁵ moles). The inset images show CA-Ag NPs (cysteamine concentration = (1) 1.5 × 10⁻⁵, (2) 3 × 10⁻⁵, (3) 6 × 10⁻⁵, (4) 1.2 × 10⁻⁴, (5) 2.4 × 10⁻⁴ moles) dispersed in ethanol. (d) HRTEM image of CA-Ag NP/Ag NWs (cysteamine concentration = 1.5 × 10⁻⁵ moles). The stable dispersion of CA-Ag NP/Ag NWs in an ethanol-water co-solvent is shown in the inset.

