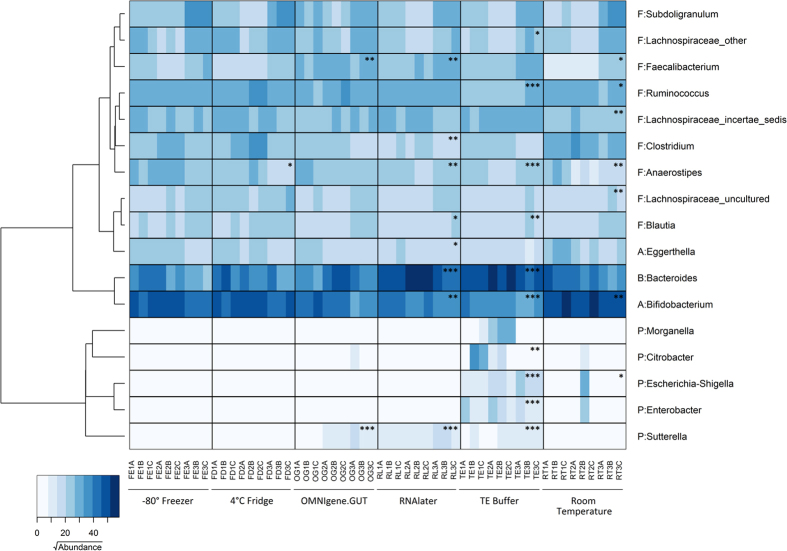
Figure 4. The distribution of the major genera in samples incubated under six different storage conditions.
The heatmap shows square root-transformed read counts for the 17 taxa identified as contributing most to variance (86% across all samples) as determined by SIMPER analysis. The dendrogram shows the similarity relationship of genera based on Bray-Curtis distance and Ward’s hierarchical clustering method. Phyla are abbreviated as follows: Actinobacteria (A), Bacteroidetes (B), Firmicutes (F) and Proteobacteria (P). Storage conditions that differ significantly from the control (−80 °C) by Mann-Whitney U-test are indicated with asterisks; single asterisk (*) represents p ≤ 0.05, double asterisk (**) represents p ≤ 0.01, and triple asterisk (***) represents p ≤ 0.001.

