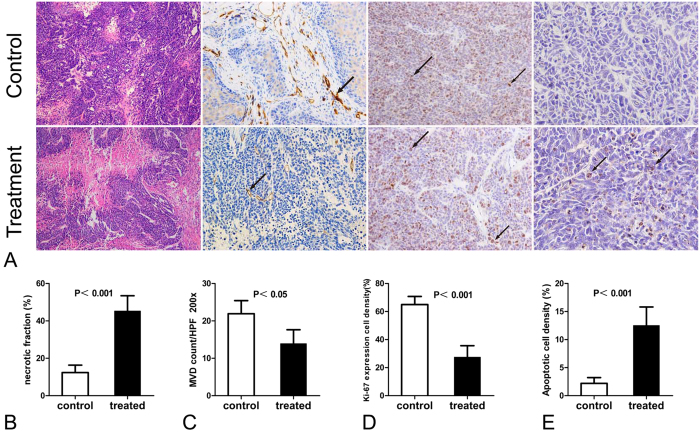
Figure 7. Histologic assessment of tumor response.
(A) Representative HE-stained (original magnification, 200×), CD31-stained (200×), Ki67-stained (400×), and TUNEL-stained (400×) slices for the control and treated groups at the end of follow-up. Apoptotic cells and cells expressing Ki-67 are indicated with arrows. Bar graphs show the (B) necrotic fraction (NF), (C) microvascular density (MVD), (D) proliferating cell density (Ki-67 index), and (E) apoptotic cell density (TUNEL index) in untreated and ZD6474-treated tumors. Error bars denote standard errors of the mean.

