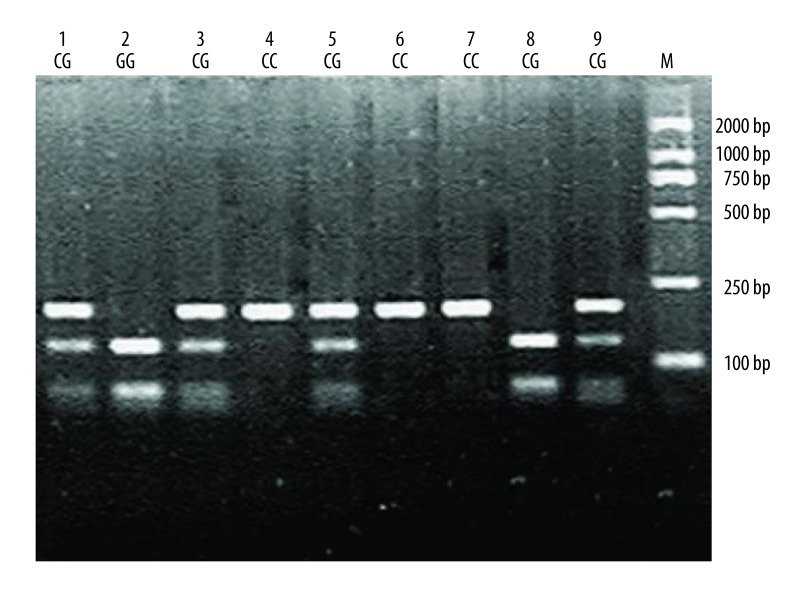
Figure 3.
Electrophoresis patterns for the genotypes of VEGF rs2010963 (−634C>G) polymorphism analyzed by PCR-RFLP-based assay. Lane M shows DNA marker. Lanes 4, 6 and 7 (180bp) show individuals with CC genotype. Lanes 1, 3, 5 and 9 (180bp, 120bp, and 60bp) show those with CG genotype. Lanes 2 and 8 (60bp and 120bp) show those with GG genotype.

