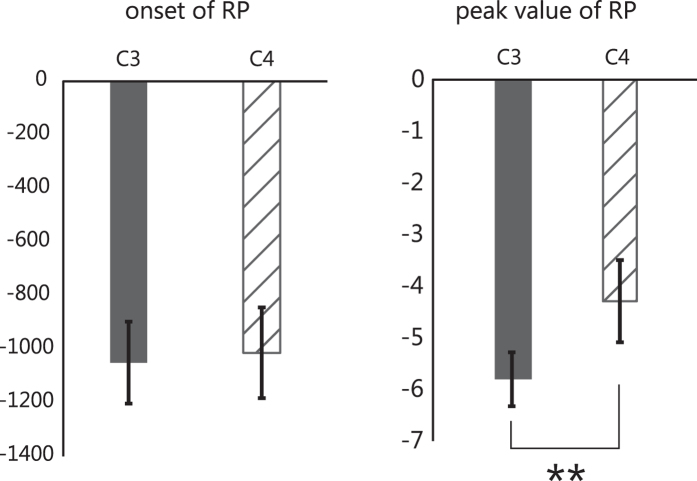
Figure 4. Results of the individual RPs on C3 and C4.
Error bars indicate standard error. (a) The average onset of RP for each hemisphere. No significant difference in the onset of RP was found (t(14) = −0.63, p = 0.54). (b) The average peak-value of RP on each hemisphere. RPs in the contralateral cortex were significantly larger than those in the ipsilateral cortex (t(14) = −3.46, p = 0.004).

