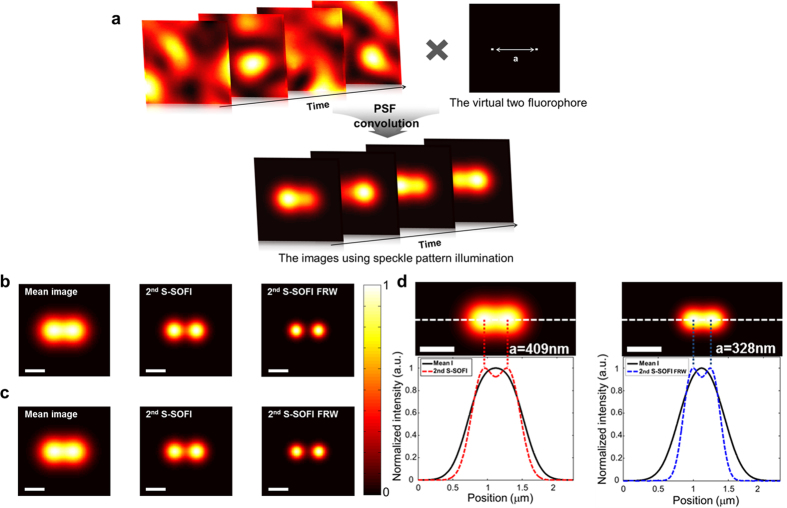
Figure 2. Schematic steps for experimental simulation and results.
(a) Each of 300 correlated speckle patterns (motorized stage step = 4 μm, objective lens NA = 0.5) provided by the experimental setup is multiplied with the virtual sample containing two fluorophores. Finally, the images produced with speckle patterns illumination were obtained by convolution using a detection point spread function with NA = 0.5. (b) Images of two fluorophores a = 544 nm apart were obtained by analytic model simulation. (c) Images of the same fluorophores as (b) were gotten using experimental simulation. Mean images were produced by averaging of 300 speckle patterns illumination images. The 2nd S-SOFI image was reconstructed using the 2nd order SOFI algorithm, and the 2nd S-SOFI FRW image was gotten from the Fourier reweighting method. (d,e) The images show the resolution limits of 2nd SOFI, and 2nd SOFI with FRW, employing the criterion of the Abbe limit. The color bar represents normalized intensity. The scale bars in all figures indicate 500 nm

