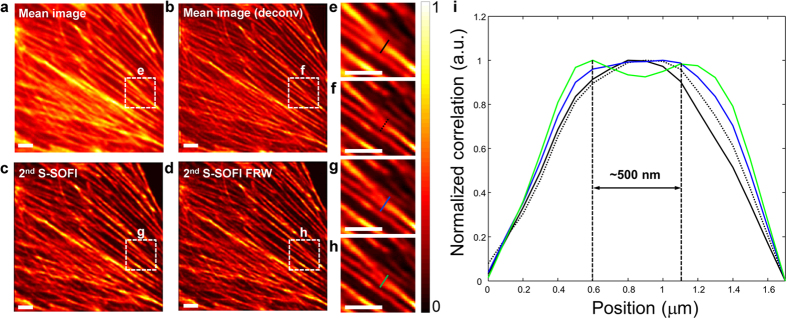
Figure 5. Experimental S-SOFI data of the biological sample obtained with a low NA (0.4) objective lens and the cross sectional intensity line profiles.
The sample is an actin filament of bovine pulmonary artery endothelial cells (BPAEC) from a biological test slide (FluoCells® prepared slide #2 (F14781), Molecular probes, Eugene, OR, USA) labeled with Texas Red (T7471, Lifetechnologies, USA). This sample images were obtained by illumination using 700 correlated speckle patterns with motorized stage with step size of 2 μm and objective lens NA = 0.4. (a) Mean image from averaging 700 images, (b) The deconvolved image of (a), (c) 2nd S-SOFI image processed by 2nd SOFI algorithm and correction, (d) 2nd S-SOFI FRW reconstructed by applying the Fourier reweighting method to 2nd SOFI images. (e–h) They are expanded images of the regions within the dashed line boxes. The color bar represents normalized intensity. (i) The cross-sectional intensity line profiles were taken from the colored dashed lines in (e–h). Black solid line indicates wide field image. Black dot line indicates deconvolution image. And each blue, green solid line indicates 2nd SOFI and 2nd SOFI FRW image, respectively. All the scale bars indicate 5 μm.

