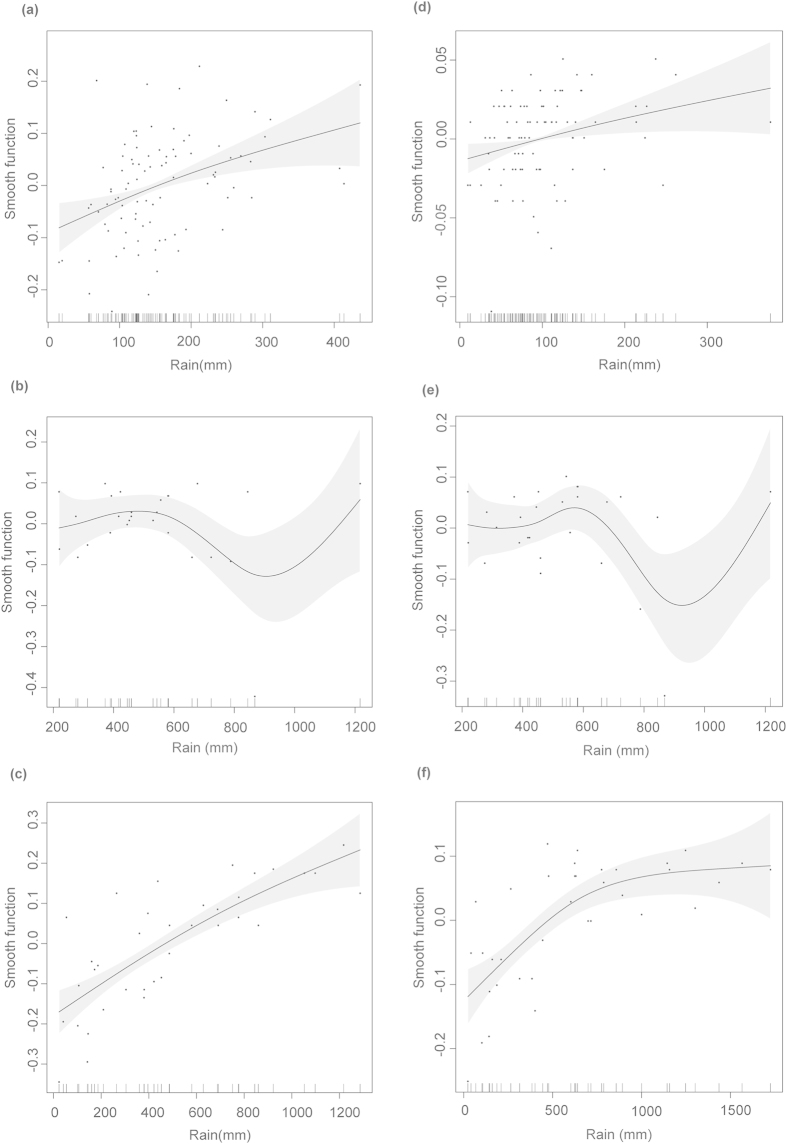
Figure 2. Generalized Additive Model (GAM) fits of local climatic conditions against hatchling output.
Smooth fits show the additive effects of significant predictors on mean monthly hatching success and emergence rate. Best predictors on hatching success were precipitation accumulated during (a) the month eggs were laid and the two previous months at Sandy Point, (b) the month eggs were laid and the month before at Pacuare and (c) the two months before eggs were laid at Playa Grande. Emergence rate predictors were precipitation accumulated (d) two months before eggs were laid at Sandy Point, (e) during the month eggs were laid and the month before at Pacuare and (f) in the month eggs were laid and two months before at Playa Grande. Best models were selected based on the minimum Akaike Information Criterion (AICc). Tick marks on the x-axis represents observed data points. Y-axis represents the smooth function and the values are centered. Gray area corresponds to two standard errors around the main effect. See supplementary Fig. S1 online for a representation of hatching success and emergence rate values against precipitation.

