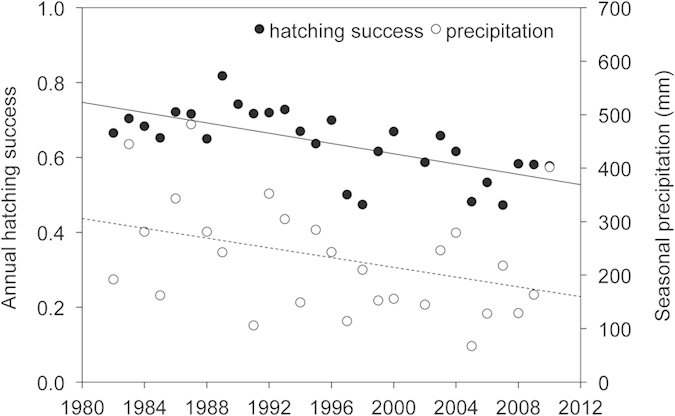
Figure 3. Changes in annual hatching success and seasonal precipitation (mm) over time at Sandy Point.

Black and dash lines show the declining trends in hatching success and seasonal precipitation respectively. Seasonal precipitation corresponds to precipitation accumulated over the four months of the nesting season.
