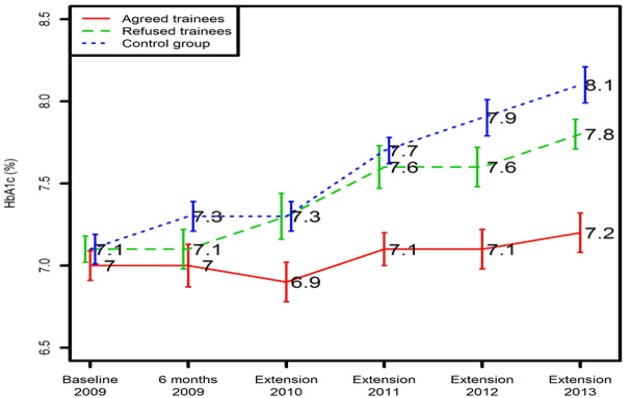
Figure 2.
Comparison of glycemic control in agreed trainees, refused trainees, and the comparison group during a 4-year observational period.
Data were presented as mean ± SE.
P = .001: Comparison of HbA1c at extension year 2013 among the accepted trainees, refused trainees, and the comparison group.

