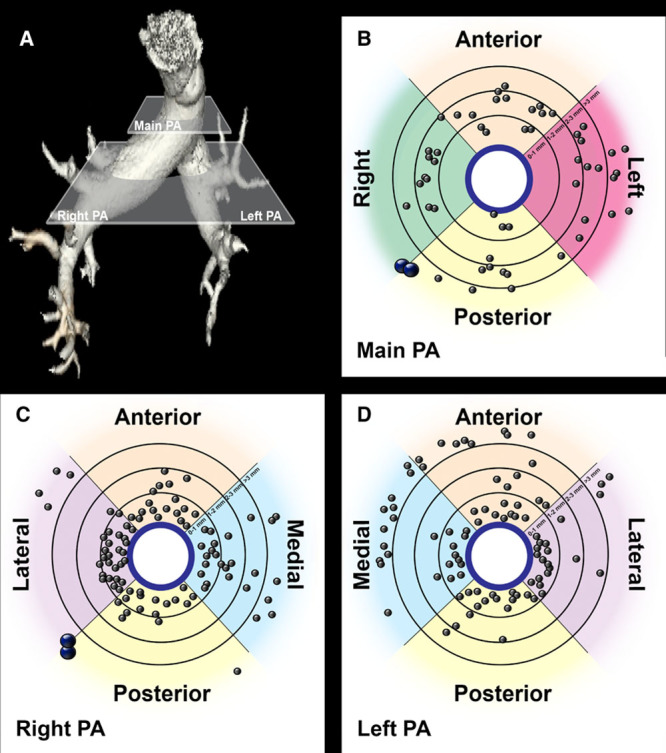
Figure 1.

Pulmonary artery (PA) nerve distribution. A, Volume reconstruction of the pulmonary arteries. Main pulmonary artery plane and right and left pulmonary artery plane represent the levels at which histological sections were taken for evaluation of nerve distribution. B–D, Idealized representation of nerve distribution around the main (B) and right (C) and left pulmonary arteries (D). Gray points represent single nerves, and blue points represent nerve trunks (n=3).
