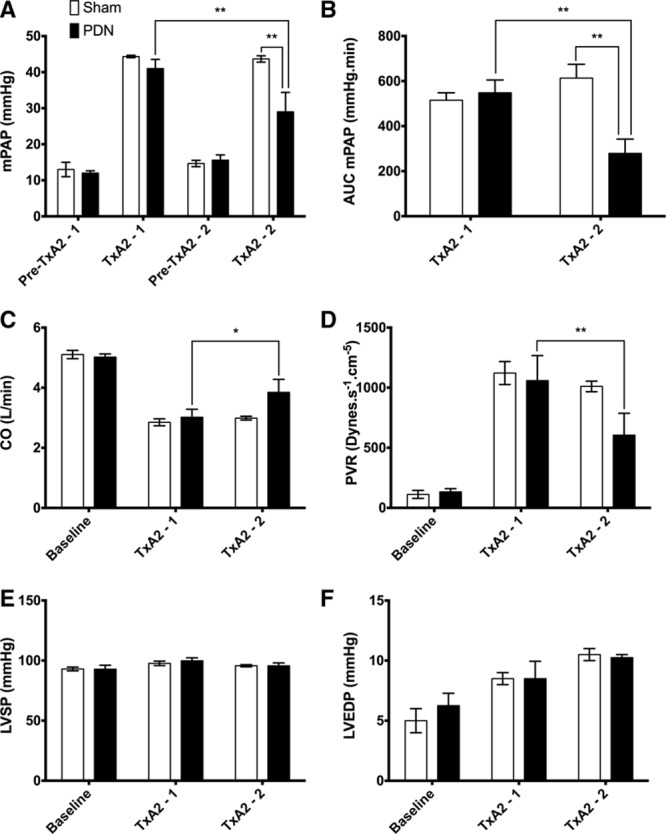
Figure 4.

Experimental study hemodynamics. A, Mean pulmonary artery pressure (mPAP) at baseline and maximum thromboxane A2 agonist (TxA2) pre (TxA2-1) and post (TxA2-2) procedure for sham- and pulmonary artery denervation (PDN)-treated animals. B, Area under the curve (AUC) of time–pressure for PDN- and sham-treated animals during the pre and post procedure TxA2 challenges, cardiac output (CO; C), pulmonary vascular resistance (PVR; D), LVSP (E), and LVEDP (F) at baseline and maximum TxA2 pre and post procedure for sham- and PDN-treated animals. PDN, n=5; Sham, n=3; mean±SEM. LVEDP indicates left ventricular end diastolic pressure; and LVSP, left ventricular systolic pressure. *P<0.05, **P<0.01, 2-way ANOVA with Sidak’s correction for multiple comparisons.
