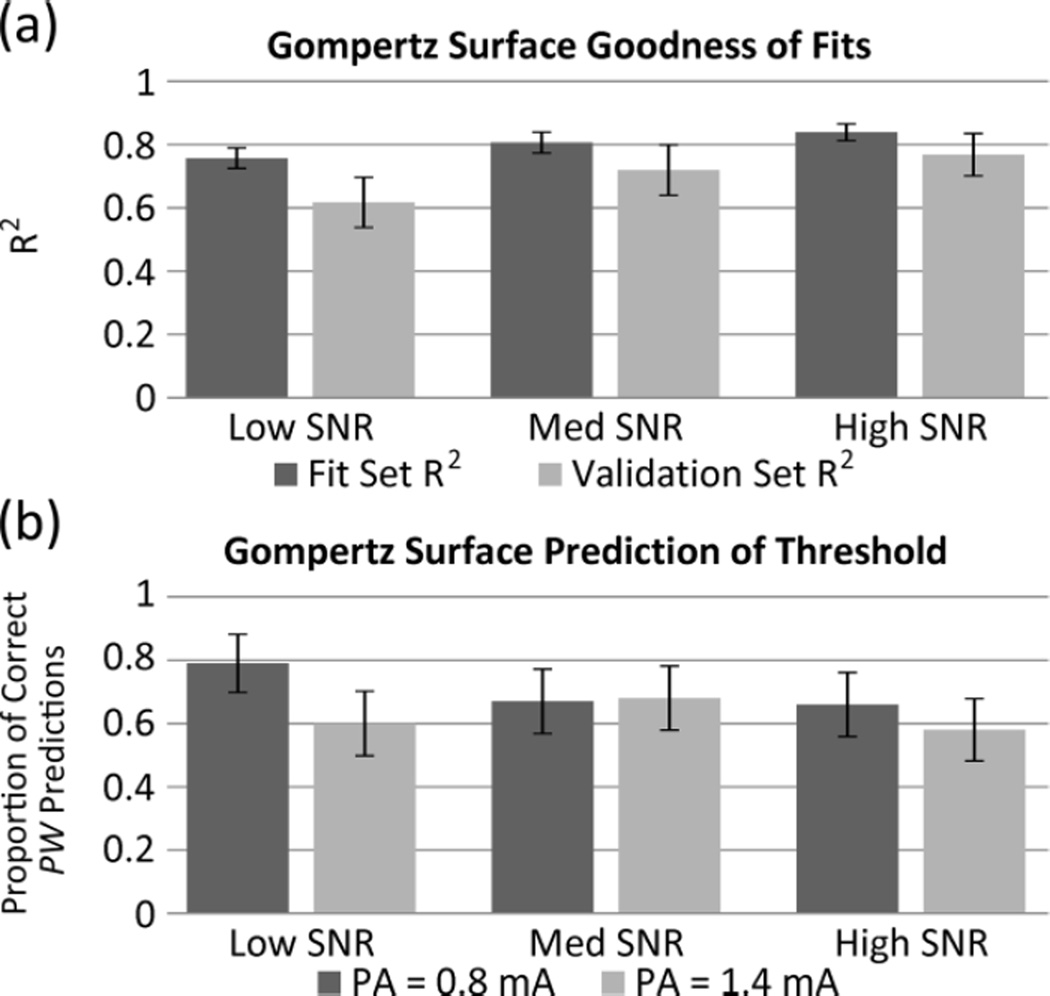
Fig. 3.
Evaluation of Gompertz Surfaces Fit to Experimental EMG Recruitment Data. EMG data were divided into equally sized groups of 25 surfaces based on the ratio of the normalized mean to standard deviation of signal at a given point (low, medium, high SNR groups). Goodness of fit was evaluated by mean R2 value (a) of both the fit and validation data sets and proportion of predictions of threshold PW (10% of maximum) that fall within the binary searches (b) at different values of PA. Error bars represent standard error of the mean.

