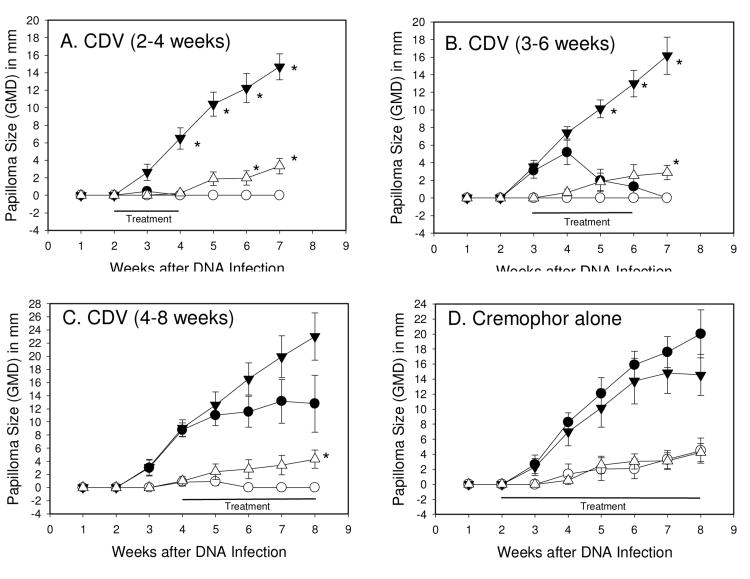
Figure 5.
Mean + SEM papilloma size of wtCRPV induced papillomas treated with compound (●) or left untreated (▼); mE8-CRPV induced papillomas treated with compound (○) or left untreated (▽). Each point represents weekly measurements of 5 papillomas on 5 rabbits. Topical treatments began at day 14 (A) and (D), day 21 (B) or day 28 (C) and were daily applications for 5 days per week. Treatments were 1% cidofovir formulated in cremophor (A, B, C) and cremophor alone (D). Left (L) sites were treated and right (R) sites were untreated. Statistics (p<0.05 marked with asterisk): (Graph A) T-test <0.05 for L1 versus R1, weeks 4-7, and L2 versus R2, weeks 6-7; (Graph B) T-test <0.05 for L1 versus R1, weeks 5-7, and Mann-Whitney Rank Sum test <0.05 for L2 versus R2, week 7; (Graph C) Mann-Whitney Rank Sum test p<0.05 L2 versus R2, week 7; (Graph D) no significant differences for any week between treated versus untreated sites.

