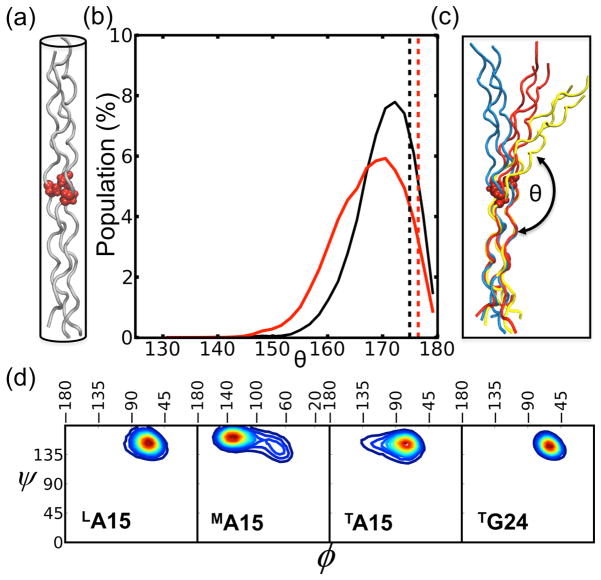
Figure 1.
(a) Schematic representation of the G→A crystal structure (PDB 1cag18) with Ala residues highlighted as red VDW balls; (b) the distributions of bend angles, θ (shown in (c). The dashed line indicates the angle of 175° and 177° calculated from crystal structure of (POG)10 (PDB 1v7h25) in black and G→A peptide in red, respectively. (c) MD selected snapshots corresponding to three bend angles (~180° in blue, ~160° in red, and ~145° in yellow) for the G→A peptide. (d) Ramachandran plot (ϕ,ψ) from the MD trajectories. Warmer colors represent higher populations.

