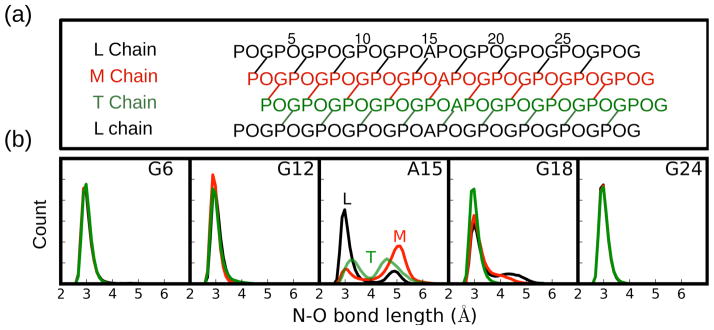
Figure 2.
Hydrogen bonding topology/patterns in the G→A peptide. (a) One residue staggering of the triple helix leads to leading (L), middle (M), and trailing (T) chains. (b) Distribution of N-O bond distances between N of the indicated residue and the carbonyl oxygen of the Pro in the neighboring chain. Chains L, M, and T are colored as black, red, and green, respectively.

