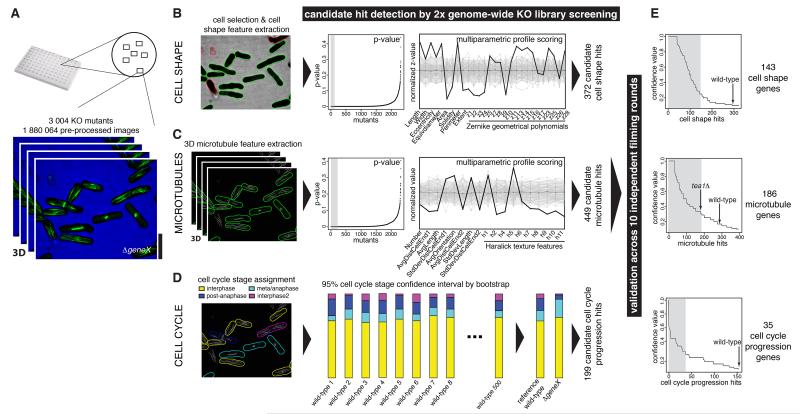
Figure 1. 3D image-based multi-process screening pipeline and multiparametric hit detection.
(A) 2× genomic screen input. 3004 gene KO strains were imaged in 96-well microplates. 3D z-stack images were collected from 6 locations per well in two fluorescence channels to detect cell outlines and GFP-microtubules. (B) and (C) Cell shape (B) and microtubule (C) hit detection strategy, using single feature p-value measurements to detect extreme hits in one feature (left) or multi-feature profile analysis to detect subtle changes across many features (right). (D) Cell cycle progression hit identification, by comparison for each mutant of the proportion of its cells assigned to each cell cycle stage compared to a bootstrapped reference wild-type. (E) 10-fold high-throughput hit validation using the strategies in (B), (C) and (D). Hits were ranked based on the fraction of independent screening rounds where they were coincidently-identified as hits (‘confidence value’). Hits with >35% confidence value were subsequently analysed. Scalebar: 10μm. See also Figures S1-S6 and Tables S1-S3.

