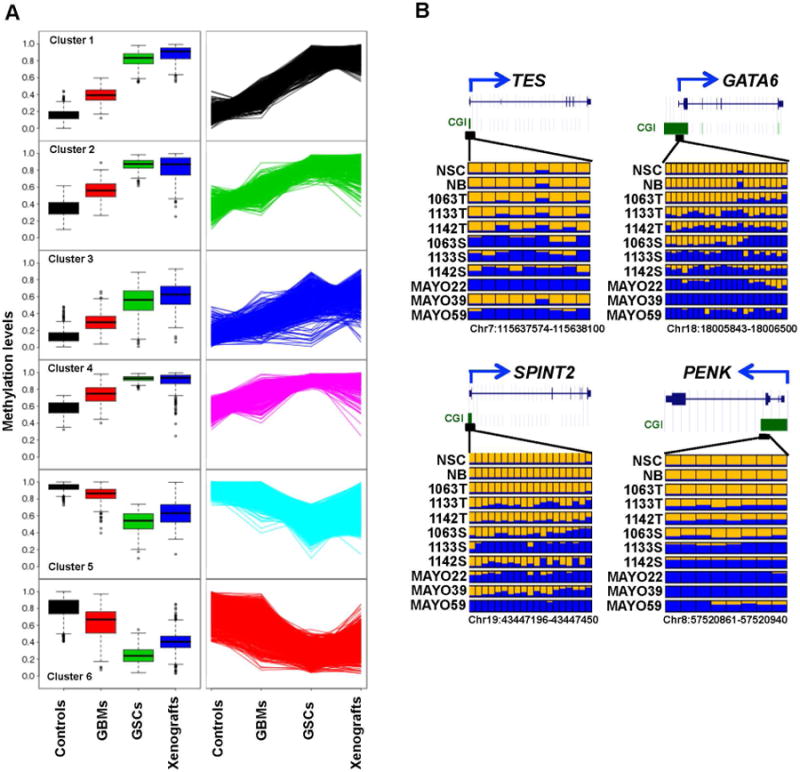
Fig. 2.

Global DNA methylation changes in primary GBMs, GSC lines and GBM xenografts compared to normal controls (NB and NSC).
A: K-mean cluster analysis of 3231 DMRs identified six distinct clusters that display an upward or downward trend of DNA methylation levels from control group to primary GBMs, and then to GSC cell lines. Box plots in the left panel show the variation and median (horizontal bars) methylation levels among four groups for each cluster. The line graphs in the right panel display the upward or downward trend of DNA methylation values from control group to primary GBMs, and then to GSC cell lines. B: DNA methylation profiles of four candidate tumor suppressor genes. In each panel, each row is the result of an individual tumor sample and each box represents an individual CpG. Yellow, no methylation; blue, methylation. The proportion of yellow and blue in each box represents the methylation level. Only common CpGs shared by all samples are shown. T refers to the primary tumor, S to the spheres of tumor cells in DN2L culture, and Mayo to the xenograft tumors.
