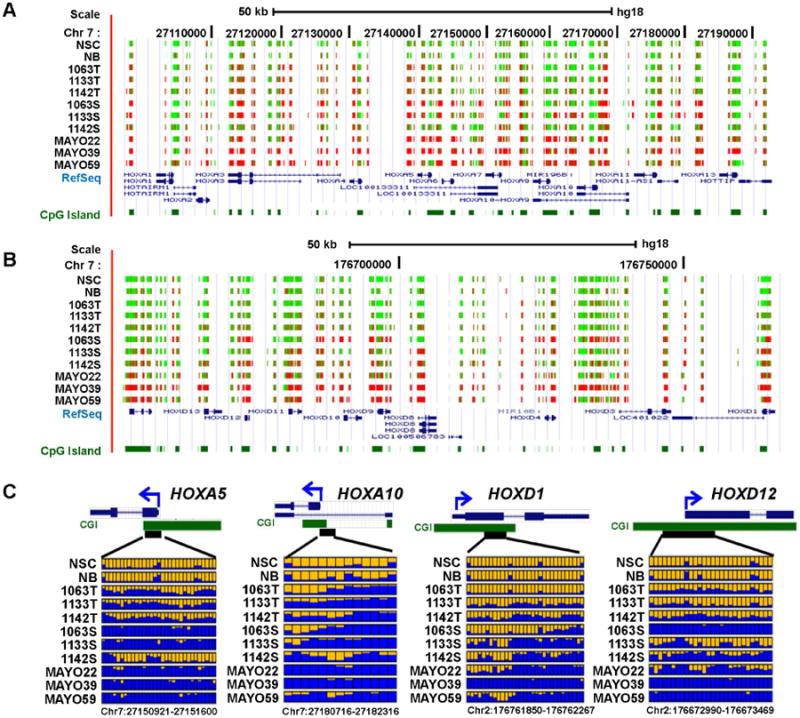
Fig. 3.

Aberrant DNA hypermethylation in HOX gene families.
A and B: UCSC genome browser screenshot illustrating the RRBS results in the HOXA and HOXD gene clusters, respectively. The tracks shown from the top to bottom in each Figure are the DNA methylation level at each CpG site derived from the bisulfite sequencing reads, RefSeq genes and annotated CpG islands in the UCSC genome browser. Red and green colors indicate methylated and unmethylated CpG sites, respectively. C: Methylation profiles of four representative HOX genes. Color scheme is consistent with in Fig. 2B.
