
Figure 6.
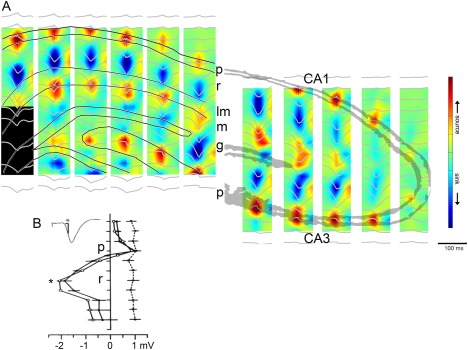
CA3 afferents drive SPWs. (A) Regional distribution of SPW currents. CSD maps (1 Hz to 10 kHz) in two different animals with the average SPW waveforms superimposed (gray traces). Note strong SPWs (sinks) in the stratum radiatum of CA1 and CA3 and the inner molecular layer of the dentate gyrus. Sinks in the inner molecular layer of the dentate gyrus possibly reflect activation of excitatory inputs from hilar mossy cells. Eight‐shank × 16 recording/site per shank probes were used to record LFP simultaneously. (B) Depth versus amplitude profiles of SPWs (filled circles) derived from a movable microelectrode (solid line) and a stationary electrode in CA1 pyramidal layer (dashed line). Each point is an average of 30 SPWs recorded concurrently with the two electrodes. Horizontal bars indicate standard error of the mean. Also shown is the depth versus amplitude profile of the simultaneously recorded field potential in response to stimulation of the Schaffer collaterals (inset, empty circles). Ordinate: 166 µm intervals. Peak amplitude of SPW (asterisk) occurs in the mid stratum radiatum. p, pyramidal layer; r, stratum radiatum, m, molecular layer; g, granule cell layer. A, reproduced after Sullivan et al. (2011). B, reproduced from Buzsáki et al. (1983).