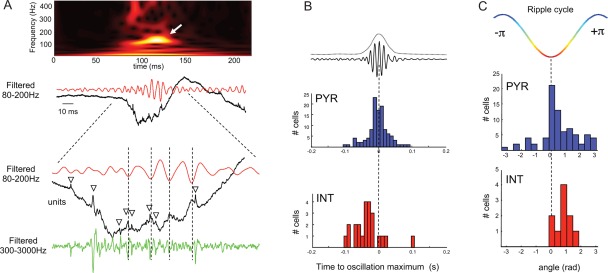
Figure 12.

Neuronal correlates of SPW‐R in the human hippocampus. (A) Single SPW‐R (black trace), its filtered version (red trace) and time–frequency representation (top). The expanded trace (bottom panel) shows spikes (triangles) during the oscillations, mostly occurring around the negative peak of ripple cycle. (B) Temporal relationship between the maximal neuronal discharge (red, interneurons; blue, pyramidal cells) and the highest peak of the ripple power. (C) Cumulative histogram of preferred firing phase for pyramidal cells (blue) and interneurons (red). Reproduced from Le van Quyen et al. (2008).
