Figure 14.

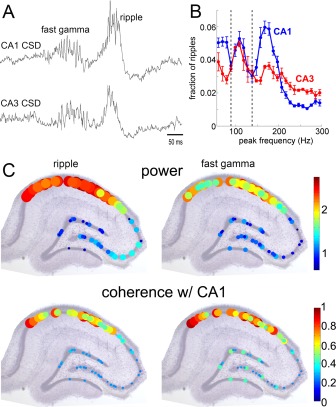
Qualitatively similar and quantitatively distinct features of ripple and fast gamma oscillations. (A) Simultaneously recorded current source density (CSD) traces from CA1 and CA3 pyramidal layers. (B) Normalized power distribution of ripples (measured at 175 Hz) and fast gamma oscillations (110 Hz) in the CA1 and CA3 cell body layers (n = 10 rats). (C) Regional distributions of power within the cell body layers (top) and phase coherence (bottom) with the most medial CA1 pyramidal layer site as the reference. The size and color of circles indicate the magnitude of power and coherence. From Sullivan et al. (2011).
