
Figure 20.
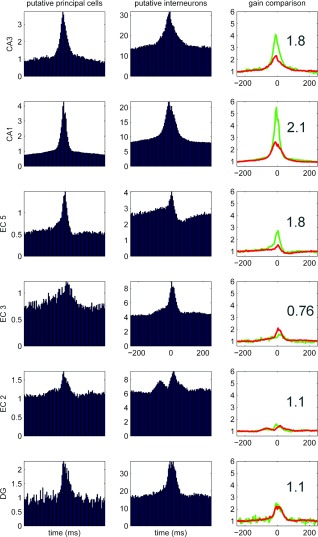
Gain and loss of excitation in different hippocampal‐entorhinal regions during SPW‐Rs. Population means of ripple‐unit cross‐correlograms in CA1, CA3 and dentate gyrus (DG) of the hippocampus and layers II, III, and V of the entorhinal cortex (EC2, EC3, EC5). Principal cells and putative interneurons are shown in the left and middle columns, respectively. Peak of the ripple episode is time 0. Right column, Relative increase of neuronal discharge, normalized to baseline (−200 to 200 ms) for both pyramidal cells (pyr, green line) and interneurons (int, red line). The ratio between the relative peaks of pyramidal cells and interneurons is defined as “gain.” Note largest excitatory gain in CA1, flowed by CA3 and EC5. Gain is balanced in DG and EC2, whereas in EC3 inhibition dominates. Data from Mizuseki et al. (2009).