
Figure 39.
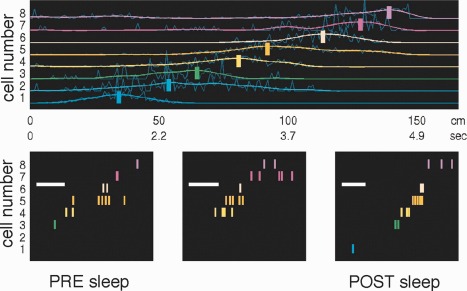
Replay of waking neuronal spike sequences during sleep in hippocampus. Smoothed place fields (colored lines) of eight place cells during runs from left to right on a track (average of 30 trials). Vertical bars mark the positions of the normalized peaks of the smoothed fields. Nonuniform time axis below shows time within an average lap when above positions were passed. Bottom panels: three SPW‐R‐related sequences from slow‐wave sleep after the waking session. Note similar sequences during SPW‐Rs and run. Note also difference in timescale. The scale bar represents 50 ms. Reproduced from Lee and Wilson (2002).