
Figure 46.
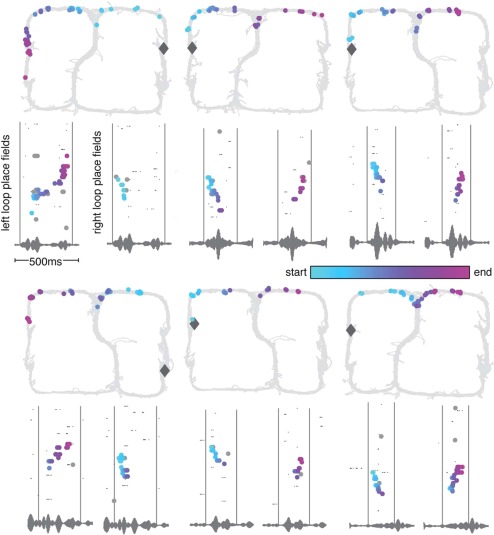
Construction of novel shortcuts by SPW‐Rs. Examples of trajectories never directly experienced by the rat. In the bottom panels, spikes are plotted by ordered place field center for both left and right loops over the same 0.5 s period. The gray vertical lines mark the beginning and end of the shortcut sequence and capture the exact same period of time on both left and right loop raster plots (as can also be seen in the repeated LFP trace). Diamond, position of the rat during SPW‐R replay. Color coding represents the trajectory of the animal. Spikes plotted on the 2D maze (top panels) to visualize the shortcut trajectories spanning the top of the maze. Note that the “shotcut” replays are not smooth but are potentially composed of an initial reverse replay of one segment followed by a forward replay of another segment of the maze (arrows). Reproduced from Gupta et al. (2010).