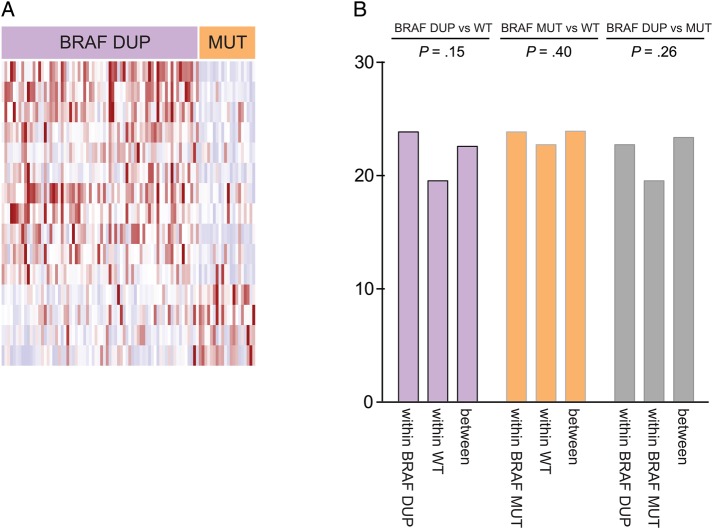
Fig. 5.
Variation in gene expression between BRAF-KIAA duplicated and BRAF–V600E-mutated tumors. (A) Heat map representing genes found to be differentially expressed between BRAF-duplicated and V600E-mutated tumors. (B) Histogram representing the Euclidean distances between and within BRAF-duplicated and wild-type (WT) tumors, between and within BRAF-V600E mutated and WT tumors, and between and within BRAF-duplicated tumors and BRAF–V600E-mutated tumors. P values represent the probability that the Euclidean distances between tumor groups are significantly higher than distances within tumor groups.

