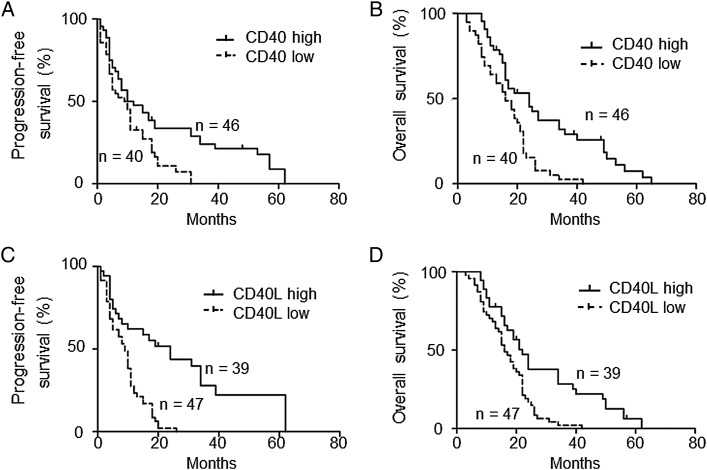
Fig. 2.
Kaplan–Meier survival curves of patients with GBM. (A, B) High expression levels of CD40 (2−Δ(ΔCt) > .01; n = 46) in patients with GBM who underwent gross total resection of the tumor were associated with longer PFS and OS compared with low expression levels (2−Δ(ΔCt) < .01; n = 40). (C, D), High expression levels of CD40L (2−Δ(ΔCt) > .001; n = 39) in patients with GBM who underwent gross total resection of the tumor were also associated with longer PFS and OS compared with low expression levels (2−Δ(ΔCt) < .001; n = 47).

