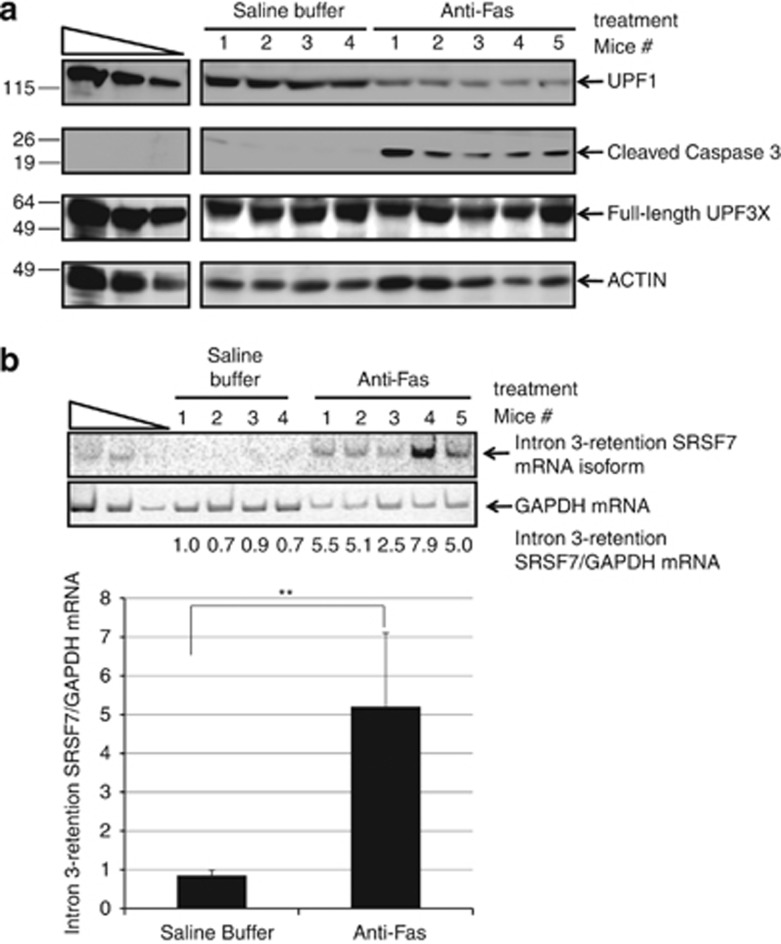
Figure 9.
NMD inhibition during apoptosis in vivo. Mice were injected with saline buffer or with anti-Fas antibody 4 h before harvesting the liver. Proteins were analyzed by western-blot (a) and mRNAs by quantitative RT-PCR (b). The three most-left lanes correspond to a serial dilution of untreated extract symbolized by a triangle. A histogram representation of the mRNA measures of panel (b) is presented under the gel. Error bar=S.D., student t-test: **P<0.05

