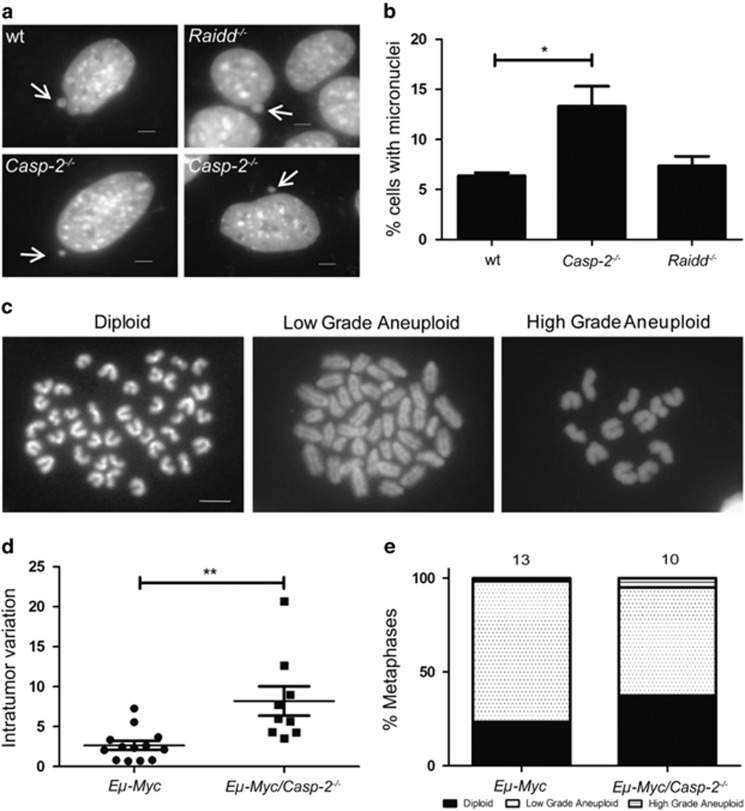
Figure 5.
Caspase-2-loss leads to increased micronuclei formation and aneuploidy. (a) Representative images of micronuclei formation in SV40 MEFs of the indicated genotypes stained with 4′,6′-diamidino-phenylinodole. Arrows indicate micronuclei formation in wt MEFs. Scale bars=5 μm. (b) Quantification of data assessed in a. A minimum of 300 cells per genotype was evaluated. Wt versus Casp-2−/− (P=0.03; Student's t-test). Bars represent mean of n>4–6 for each genotype±S.E.M. (c) Representative images of chromosome spreads using freshly isolated Eμ-Myc lymphoma cells. Metaphase spreads are showing representative euploid (left panel) or aneuploidy karyogramms ranging from low (middle panel) to high-grade (right panel). Scale bar=5 μm. A minimum of 50 spreads per genotype was evaluated. (d) Variation of counted chromosome numbers within single tumors from Eμ-Myc (n=13) versus Eμ-Myc/Casp-2−/− (n=10) mice (P=0.0029; Student's t-test). (e) Quantification of the variance of chromosome numbers in tumors derived from indicated genotypes. A χ2 test showed a significant difference between wt and Casp-2−/− (P<0.0001)

