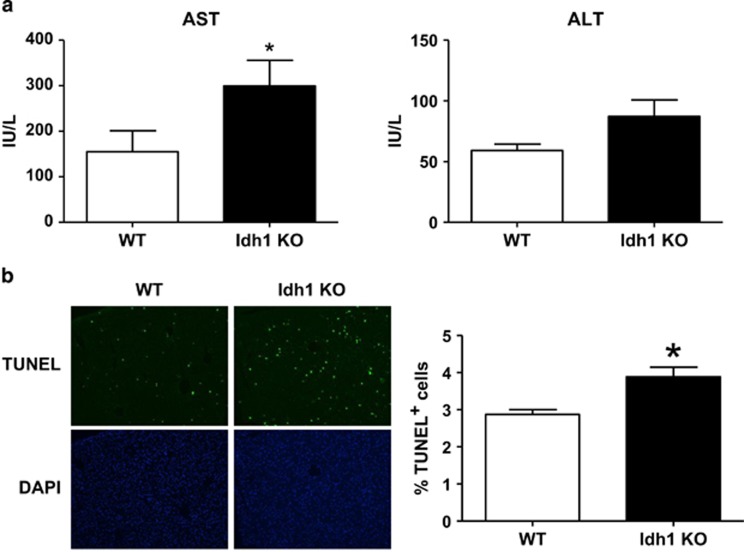
Figure 4.
Loss of Idh1 exacerbates LPS-induced liver injury. (a) Quantitation of serum levels of (top) AST and (bottom) ALT in Idh1 KO and WT mice that received a sublethal LPS dose. Blood samples were collected at 6 h after LPS injection. Data are expressed as the fold change relative to values in LPS-treated WT mice and are the mean±S.D. (n=6). *P<0.05. (b) TUNEL staining of apoptotic cells in the livers of the mice in (a), which were killed at 12 h after LPS injection. Top: TUNEL staining; bottom: DAPI (4',6-diamidino-2-phenylindole). Magnification × 10. Quantitation of apoptotic cells in the livers was shown on the right. Data were collected as described in Materials and Methods and are the mean percentage of TUNEL+ cells±S.D. *P<0.05

