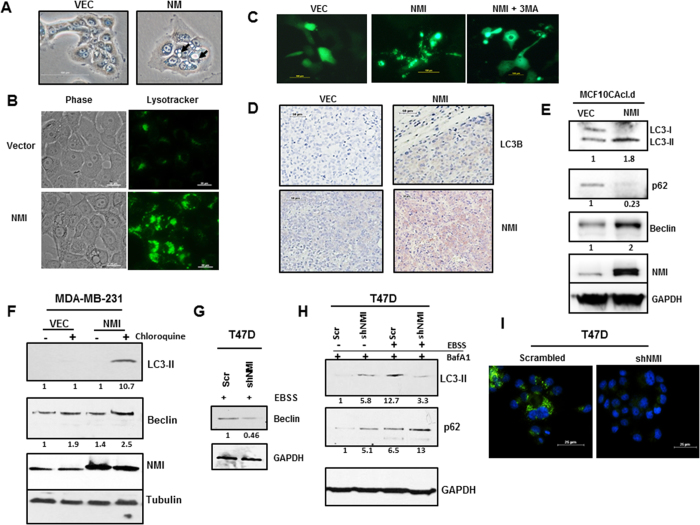
Figure 1. NMI alters autophagy in breast cancer.
(A) MCF10CAcl.d vector or NMI cells visualized with phase contrast, arrows indicate vacuolated structures in NMI cells. (B) MCF10CAcl.d Vector and NMI cells were stained with 1 μM Lysotracker to visualize acidic vacuoles. (C) MCF10CAcl.d Vector and NMI cells transfected with LC3-GFP or in combination with 3 MA, images taken at 48 hours after transfection (scale bar = 100 μm). (D) Tumor xenografts of MDA-MB-231 Vector or NMI stained for LC3B or NMI. Images taken at 20X (scale bar = 50 μm) (E) Immunoblot analysis of markers for autophagy of LC3B, p62 and Beclin in MCF10CAcl.d vector and NMI cells. Full-length blots are presented in Supplementary Figure 1. (F) Stress induced autophagy of MDA-MB-231 vector and NMI cells treated with EBSS for 1 hour with or without the addition of 20 μM chloroquine. Full-length blots are presented in Supplementary Figure 2. (G) T47D cells silenced for NMI treated with EBSS and Beclin levels were determined using immunoblot analysis. (H) T47D cells silenced for NMI treated in 100 nM BafA1 then treated with EBSS for 1 hour to assay effects on autophagy using immunoblot analysis of LC3B and p62. Full-length blots are presented in Supplementary Figure 3. Fold change determined by densitometry analysis is indicated below each lane of corresponding blots. (I) T47D silenced cells were EBSS starved and stained using Cyto-ID autophagy detection kit. (scale bar = 25 μm)

