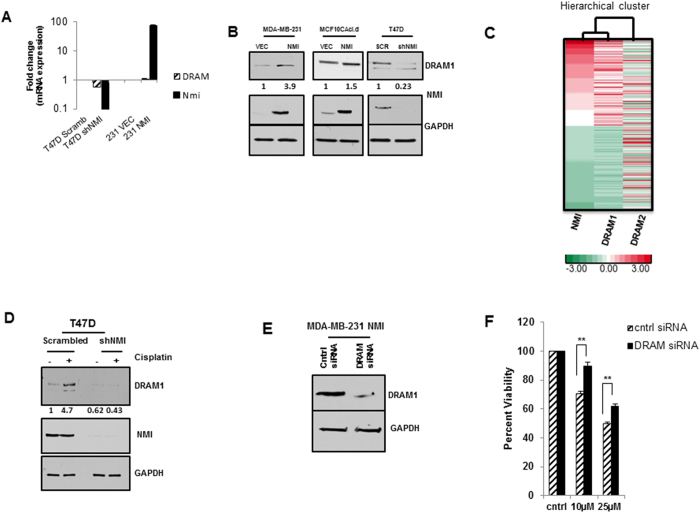
Figure 4. NMI affects chemoresistance via DRAM1.
(A) Quantitative RT-PCR analysis of T47D NMI silenced and MDA-MB-231 NMI cells for DRAM1 and NMI mRNA levels. Data are normalized to GAPDH expression and fold changes in expression (log10) are relative to corresponding vector or scrambled control. (B) Immunoblot analysis of DRAM1 expression in NMI cells restored for NMI or silenced for NMI, GAPDH used as loading control. Full-length blots are presented in Supplementary Figure 9, 10, 11. (C) TCGA data was analyzed for trends of NMI and DRAM1 expressions (n = 273, NMI-H and DRAM1-H, NMI-L and DRAM1-L) were clustered based on expressions of NMI, DRAM1 and DRAM2 as a control (H = high L = low). Red = high; green = low. (D) T47D scrambled and silenced cells were treated with 20 μM cisplatin or DMSO for 24 hours and subjected to immunoblot analysis for DRAM1. Full-length blots are presented in Supplementary Figure 12. Fold change determined by densitometry analysis is indicated below each lane of corresponding blots. (E) MDA-MB-231 NMI expressing cells transfected with 100 nM siRNA to DRAM1 and confirmed for knockdown 48 hours post-transfection. Full-length blots are presented in Supplementary Figure 13. (F) MDA-MB-231 NMI cells transfected with 100 nM DRAM siRNA or non-target control and were subsequently treated with 10 μM or 25 μM cisplatin for 48 hours. Cell viability was determined by MTS and percent viability is measured as fold change of corresponding vehicle control (*p = .0025, **p = .0015).

