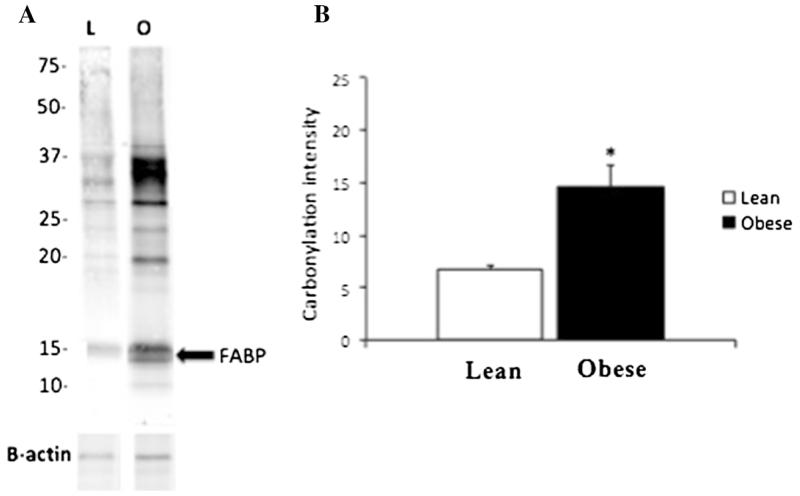
Fig. 4.
Protein carbonylation comparison between lean and obese patients. Panel (a) shows a representative blot from one lean to one obese individual where the fatty acid binding protein band is denoted by an arrow. b For each individual, total carbonylation was quantified by analysis of the signal intensity for the entire lane (excluding the 67-kDa albumin band). On average, the obese group (n=5) showed significantly higher carbonylation when compared to the lean cohort of patients (n=5) (*p<0.05). FABP fatty acid binding protein

