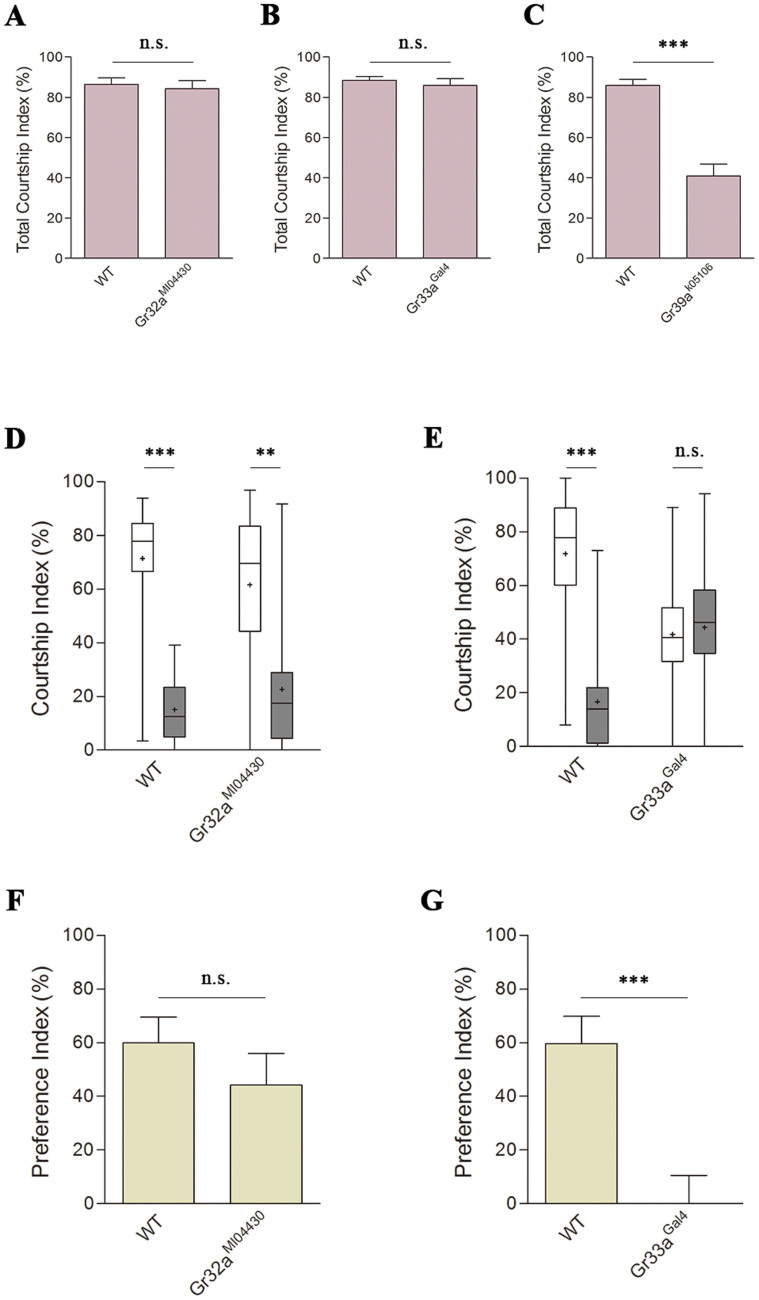
Figure 1. The roles of Grs in males' courtship preference behavior.
(A) Total courtship indices of wild type males and Gr32a mutant males in courtship choice assays. Mean ± standard error of the mean (SEM), n = 21 for wild type males and 24 for Gr32a mutant males. n.s., p > 0.5, Mann-Whitney U test. (B) Total courtship indices of wild type males and Gr33a mutant males in courtship choice assays. Mean ± standard error of the mean (SEM), n = 21 for wild type males and 22 for Gr33a mutant males. n.s., p > 0.5, Mann-Whitney U test. (C) Total courtship indices of wild type males and Gr39a mutant males in courtship choice assays. Mean ± standard error of the mean (SEM), n = 20 for wild type males and 22 for Gr39a mutant males. Three asterisks, p < 0.001, Mann-Whitney U test. (D) Courtship indices of wild type males and Gr32a mutant males in courtship choice assays towards younger mates (bar colored white) and older ones (bar colored grey), respectively. Box-and-whisker plots for CIs show 1–99 percentiles and mean (+). Two asterisks, p < 0.01, three asterisks, p < 0.001, Related-samples Wilcoxon Signed Rank test. (E) Courtship indices of wild type males and Gr33a mutant males in courtship choice assays towards younger mates (white) and older ones (grey), respectively. Box-and-whisker plots for CIs show 1–99 percentiles and mean (+). n.s., p > 0.5, three asterisks, p < 0.001, Related-samples Wilcoxon Signed Rank test. (F) Preference indices of wild type males and Gr32a mutant males in courtship choice assays. Mean ± standard error of the mean (SEM). n.s., p > 0.5, Mann-Whitney U test. (G) Preference indices of wild type males and Gr33a mutant males in courtship choice assays. Mean ± standard error of the mean (SEM). Three asterisks, p < 0.001, Mann-Whitney U test.

