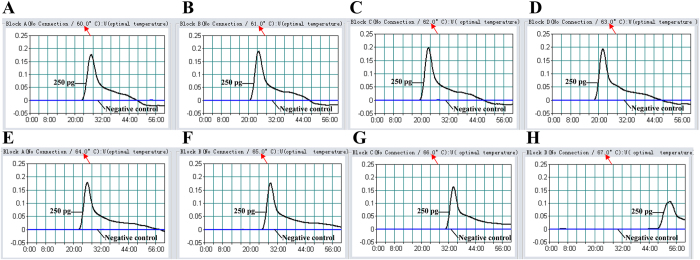
Figure 5. The optimal temperature for the MCDA assay.
The MCDA reactions were monitored by real-time measurement of turbidity and the corresponding curves of concentrations of DNA were marked in the Figure. The threshold value was 0.1 and the turbidity of >0.1 was considered to be positive. Eight kinetic graphs (A–H) were obtained at different temperature (60–67 °C) with L. monocytogenes DNA at the level of 250 pg per reaction, and the graphs from B to F showed robust amplification.

