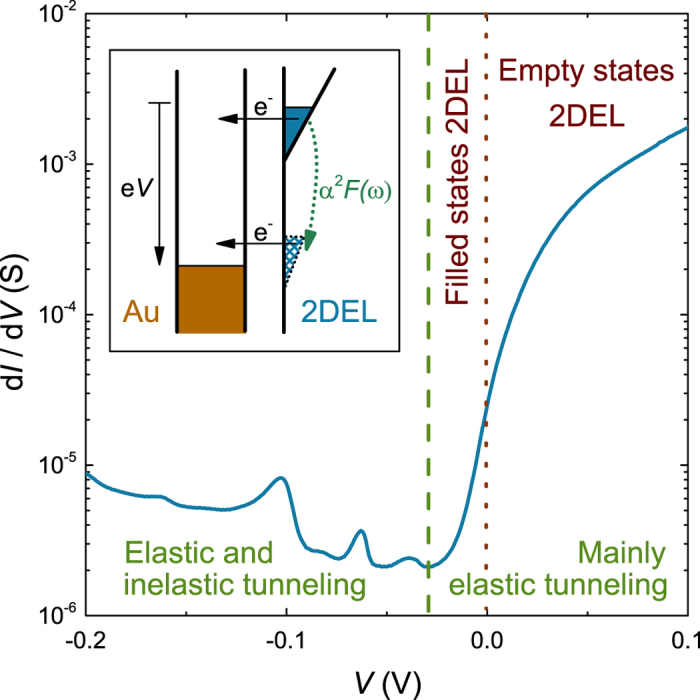
Figure 1. dI/dV (V) tunneling characteristic measured at T = 4.2 K.

The dashed green line separates the voltage ranges where elastic and inelastic tunneling dominate in the transport. For V > 0 electrons tunnel from the Au electrode into unoccupied states in the 2DEL and for V < 0 electrons tunnel from the 2DEL into the Au. In the inelastic tunneling regime, the transport is mainly by phonon—assisted tunneling with SrTiO3 phonon modes. This process is illustrated in the density of states versus energy diagram (DOS(E)) of the junction in the inset, here the density of states of Au is shown on the left, that of the 2DEL on the right. If driven by voltages so large that their energy exceed phonon energies, electrons in the occupied states of the 2DEL (blue area) tunnel directly into the Au or they first make a transition to a virtual state in the gap by emitting a phonon (dashed blue area) and then transfer into the Au. Note that the linear form of the DOS(E) shown in the schematic is not the actual DOS(E) of the 2DEL.
