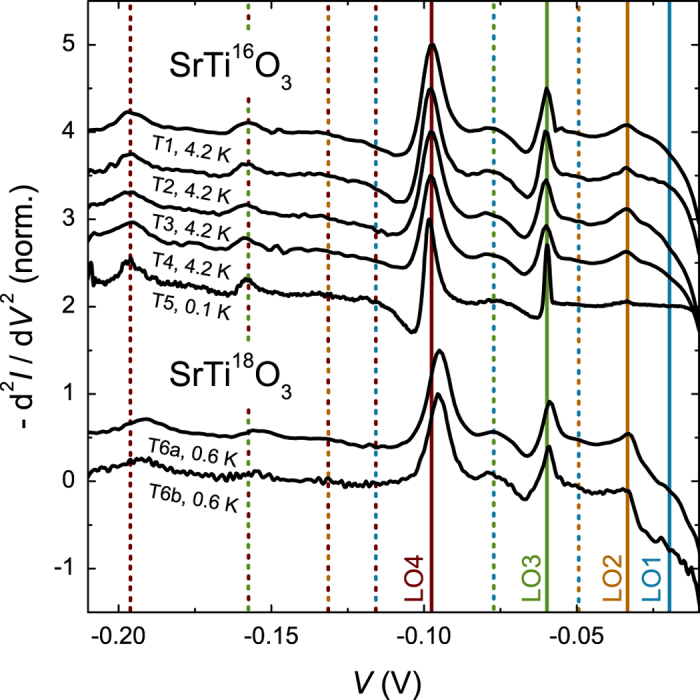
Figure 2. The second derivative –d2I/dV2(V) characteristics of tunnel junctions showing phonon—assisted tunneling.

The data were normalized to a maximum of 1 and offset by multiples of 0.5. Samples T1, T2, T3, T4 and T6 have a 4 unit cell thick LaAlO3 layer, while sample T5 has a five unit cell thick layer. The colored solid lines mark the energies of the LO phonon modes. Dashed lines mark sums and harmonics of these energies with the same color code. The two devices on the LaAlO3—SrTi18O3 sample are referred to by T6a and T6b.
