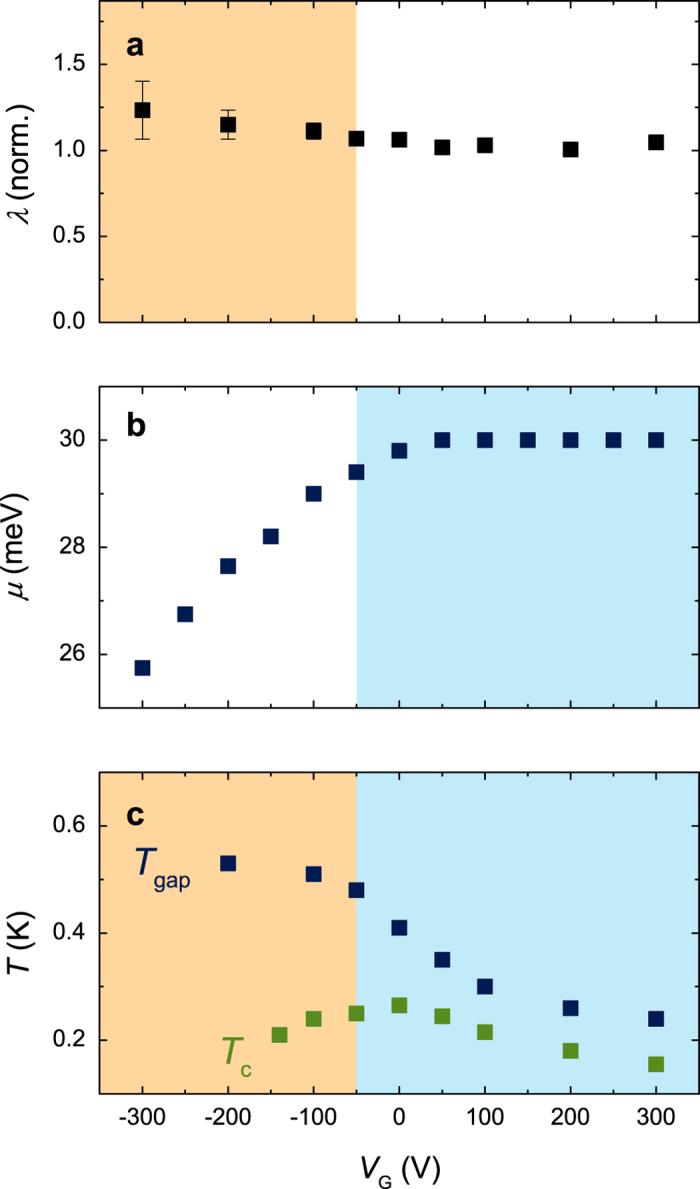
Figure 6.

Gate voltage dependence of a) λ, b) μ and c) Tgap and Tc. The values for λ are normalized to those in the overdoped region. In the underdoped region (brown background) the doping dependence of Tgap coincides with a change in λ. In the optimally doped and overdoped regions (blue background) the reduction of Tgap coincides with a lack of increase of μ with increasing carrier density, indicating the additional charge carriers do not reside in the band that is superconducting, but interfere. The error margins of λ reflect the uncertainty in the background subtraction procedure. The values for Tgap and Tc are taken from an earlier publication15.
